Scottish vs Ute Median Family Income
COMPARE
Scottish
Ute
Median Family Income
Median Family Income Comparison
Scottish
Ute
$104,288
MEDIAN FAMILY INCOME
69.5/ 100
METRIC RATING
160th/ 347
METRIC RANK
$87,596
MEDIAN FAMILY INCOME
0.0/ 100
METRIC RATING
293rd/ 347
METRIC RANK
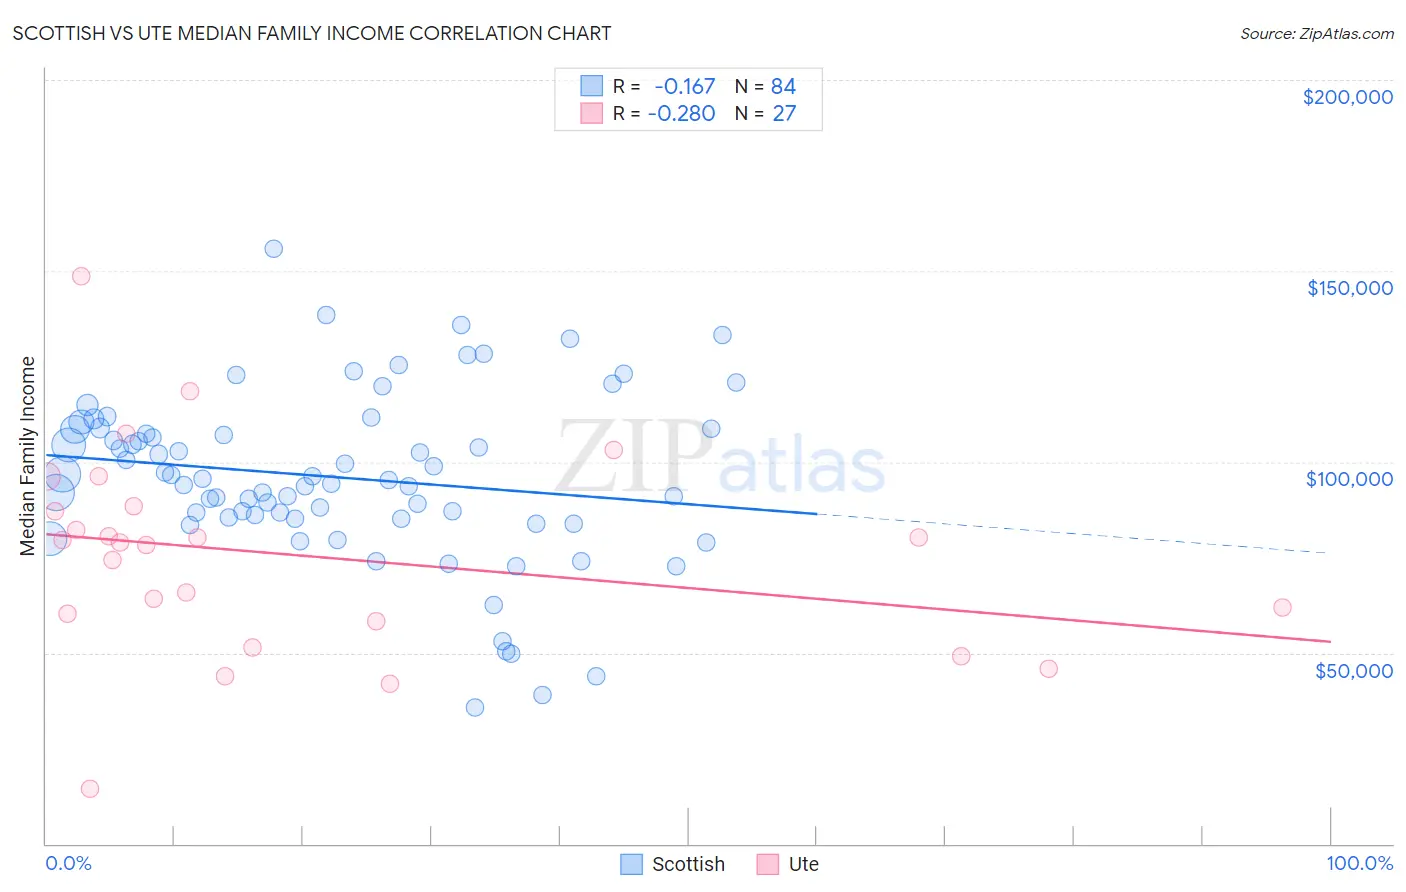
Scottish vs Ute Median Family Income Correlation Chart
The statistical analysis conducted on geographies consisting of 565,809,702 people shows a poor negative correlation between the proportion of Scottish and median family income in the United States with a correlation coefficient (R) of -0.167 and weighted average of $104,288. Similarly, the statistical analysis conducted on geographies consisting of 55,656,168 people shows a weak negative correlation between the proportion of Ute and median family income in the United States with a correlation coefficient (R) of -0.280 and weighted average of $87,596, a difference of 19.1%.
Median Family Income Correlation Summary
| Measurement | Scottish | Ute |
| Minimum | $35,833 | $14,519 |
| Maximum | $155,822 | $148,724 |
| Range | $119,989 | $134,205 |
| Mean | $95,991 | $75,455 |
| Median | $95,418 | $78,980 |
| Interquartile 25% (IQ1) | $85,332 | $58,333 |
| Interquartile 75% (IQ3) | $108,630 | $88,500 |
| Interquartile Range (IQR) | $23,298 | $30,167 |
| Standard Deviation (Sample) | $22,327 | $27,197 |
| Standard Deviation (Population) | $22,194 | $26,688 |
Similar Demographics by Median Family Income
Demographics Similar to Scottish by Median Family Income
In terms of median family income, the demographic groups most similar to Scottish are Icelander ($104,282, a difference of 0.010%), Swiss ($104,396, a difference of 0.10%), Scandinavian ($104,410, a difference of 0.12%), Moroccan ($104,488, a difference of 0.19%), and Immigrants from Sierra Leone ($103,990, a difference of 0.29%).
| Demographics | Rating | Rank | Median Family Income |
| Slavs | 77.9 /100 | #153 | Good $105,144 |
| Immigrants | Nepal | 76.3 /100 | #154 | Good $104,966 |
| Native Hawaiians | 75.8 /100 | #155 | Good $104,910 |
| Basques | 74.4 /100 | #156 | Good $104,760 |
| Moroccans | 71.6 /100 | #157 | Good $104,488 |
| Scandinavians | 70.8 /100 | #158 | Good $104,410 |
| Swiss | 70.7 /100 | #159 | Good $104,396 |
| Scottish | 69.5 /100 | #160 | Good $104,288 |
| Icelanders | 69.4 /100 | #161 | Good $104,282 |
| Immigrants | Sierra Leone | 66.2 /100 | #162 | Good $103,990 |
| Costa Ricans | 66.2 /100 | #163 | Good $103,989 |
| Sierra Leoneans | 64.7 /100 | #164 | Good $103,859 |
| Slovaks | 63.1 /100 | #165 | Good $103,729 |
| English | 62.6 /100 | #166 | Good $103,684 |
| South American Indians | 61.9 /100 | #167 | Good $103,624 |
Demographics Similar to Ute by Median Family Income
In terms of median family income, the demographic groups most similar to Ute are Fijian ($87,387, a difference of 0.24%), African ($87,820, a difference of 0.26%), Immigrants from Cabo Verde ($87,830, a difference of 0.27%), Shoshone ($87,872, a difference of 0.32%), and Yaqui ($87,289, a difference of 0.35%).
| Demographics | Rating | Rank | Median Family Income |
| Immigrants | Nicaragua | 0.1 /100 | #286 | Tragic $88,267 |
| Potawatomi | 0.1 /100 | #287 | Tragic $88,265 |
| Cherokee | 0.1 /100 | #288 | Tragic $88,209 |
| Central American Indians | 0.1 /100 | #289 | Tragic $88,034 |
| Shoshone | 0.1 /100 | #290 | Tragic $87,872 |
| Immigrants | Cabo Verde | 0.1 /100 | #291 | Tragic $87,830 |
| Africans | 0.1 /100 | #292 | Tragic $87,820 |
| Ute | 0.0 /100 | #293 | Tragic $87,596 |
| Fijians | 0.0 /100 | #294 | Tragic $87,387 |
| Yaqui | 0.0 /100 | #295 | Tragic $87,289 |
| Immigrants | Guatemala | 0.0 /100 | #296 | Tragic $87,191 |
| Cajuns | 0.0 /100 | #297 | Tragic $87,157 |
| Immigrants | Latin America | 0.0 /100 | #298 | Tragic $86,989 |
| Chippewa | 0.0 /100 | #299 | Tragic $86,852 |
| Ottawa | 0.0 /100 | #300 | Tragic $86,380 |