Scottish vs Immigrants from Russia Median Family Income
COMPARE
Scottish
Immigrants from Russia
Median Family Income
Median Family Income Comparison
Scottish
Immigrants from Russia
$104,288
MEDIAN FAMILY INCOME
69.5/ 100
METRIC RATING
160th/ 347
METRIC RANK
$116,942
MEDIAN FAMILY INCOME
99.9/ 100
METRIC RATING
46th/ 347
METRIC RANK
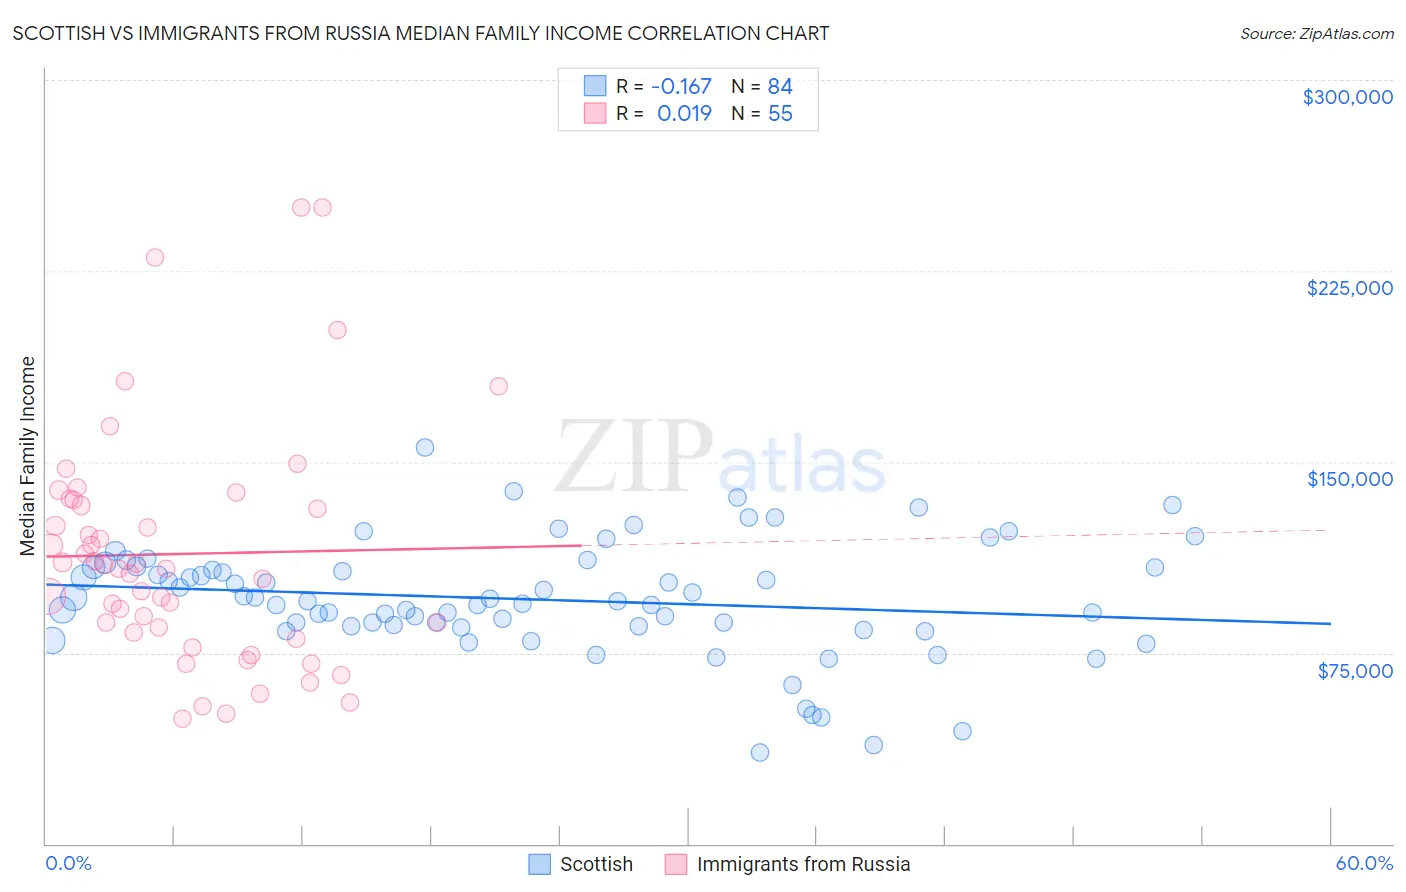
Scottish vs Immigrants from Russia Median Family Income Correlation Chart
The statistical analysis conducted on geographies consisting of 565,809,702 people shows a poor negative correlation between the proportion of Scottish and median family income in the United States with a correlation coefficient (R) of -0.167 and weighted average of $104,288. Similarly, the statistical analysis conducted on geographies consisting of 347,641,134 people shows no correlation between the proportion of Immigrants from Russia and median family income in the United States with a correlation coefficient (R) of 0.019 and weighted average of $116,942, a difference of 12.1%.
Median Family Income Correlation Summary
| Measurement | Scottish | Immigrants from Russia |
| Minimum | $35,833 | $49,167 |
| Maximum | $155,822 | $250,001 |
| Range | $119,989 | $200,834 |
| Mean | $95,991 | $113,842 |
| Median | $95,418 | $107,999 |
| Interquartile 25% (IQ1) | $85,332 | $83,101 |
| Interquartile 75% (IQ3) | $108,630 | $134,951 |
| Interquartile Range (IQR) | $23,298 | $51,850 |
| Standard Deviation (Sample) | $22,327 | $46,059 |
| Standard Deviation (Population) | $22,194 | $45,638 |
Similar Demographics by Median Family Income
Demographics Similar to Scottish by Median Family Income
In terms of median family income, the demographic groups most similar to Scottish are Icelander ($104,282, a difference of 0.010%), Swiss ($104,396, a difference of 0.10%), Scandinavian ($104,410, a difference of 0.12%), Moroccan ($104,488, a difference of 0.19%), and Immigrants from Sierra Leone ($103,990, a difference of 0.29%).
| Demographics | Rating | Rank | Median Family Income |
| Slavs | 77.9 /100 | #153 | Good $105,144 |
| Immigrants | Nepal | 76.3 /100 | #154 | Good $104,966 |
| Native Hawaiians | 75.8 /100 | #155 | Good $104,910 |
| Basques | 74.4 /100 | #156 | Good $104,760 |
| Moroccans | 71.6 /100 | #157 | Good $104,488 |
| Scandinavians | 70.8 /100 | #158 | Good $104,410 |
| Swiss | 70.7 /100 | #159 | Good $104,396 |
| Scottish | 69.5 /100 | #160 | Good $104,288 |
| Icelanders | 69.4 /100 | #161 | Good $104,282 |
| Immigrants | Sierra Leone | 66.2 /100 | #162 | Good $103,990 |
| Costa Ricans | 66.2 /100 | #163 | Good $103,989 |
| Sierra Leoneans | 64.7 /100 | #164 | Good $103,859 |
| Slovaks | 63.1 /100 | #165 | Good $103,729 |
| English | 62.6 /100 | #166 | Good $103,684 |
| South American Indians | 61.9 /100 | #167 | Good $103,624 |
Demographics Similar to Immigrants from Russia by Median Family Income
In terms of median family income, the demographic groups most similar to Immigrants from Russia are Immigrants from Austria ($116,830, a difference of 0.10%), Immigrants from Greece ($117,344, a difference of 0.34%), Immigrants from South Africa ($116,286, a difference of 0.56%), Chinese ($116,188, a difference of 0.65%), and Immigrants from Czechoslovakia ($116,165, a difference of 0.67%).
| Demographics | Rating | Rank | Median Family Income |
| Immigrants | Asia | 100.0 /100 | #39 | Exceptional $118,291 |
| Immigrants | Lithuania | 100.0 /100 | #40 | Exceptional $118,053 |
| Estonians | 100.0 /100 | #41 | Exceptional $118,013 |
| Immigrants | Bolivia | 100.0 /100 | #42 | Exceptional $117,912 |
| Bulgarians | 100.0 /100 | #43 | Exceptional $117,818 |
| Cambodians | 100.0 /100 | #44 | Exceptional $117,780 |
| Immigrants | Greece | 99.9 /100 | #45 | Exceptional $117,344 |
| Immigrants | Russia | 99.9 /100 | #46 | Exceptional $116,942 |
| Immigrants | Austria | 99.9 /100 | #47 | Exceptional $116,830 |
| Immigrants | South Africa | 99.9 /100 | #48 | Exceptional $116,286 |
| Chinese | 99.9 /100 | #49 | Exceptional $116,188 |
| Immigrants | Czechoslovakia | 99.9 /100 | #50 | Exceptional $116,165 |
| Immigrants | Malaysia | 99.9 /100 | #51 | Exceptional $115,880 |
| Maltese | 99.9 /100 | #52 | Exceptional $115,862 |
| Immigrants | Norway | 99.9 /100 | #53 | Exceptional $115,847 |