Nepalese vs Immigrants from Africa Householder Income Over 65 years
COMPARE
Nepalese
Immigrants from Africa
Householder Income Over 65 years
Householder Income Over 65 years Comparison
Nepalese
Immigrants from Africa
$58,761
HOUSEHOLDER INCOME OVER 65 YEARS
9.0/ 100
METRIC RATING
214th/ 347
METRIC RANK
$59,837
HOUSEHOLDER INCOME OVER 65 YEARS
23.4/ 100
METRIC RATING
194th/ 347
METRIC RANK
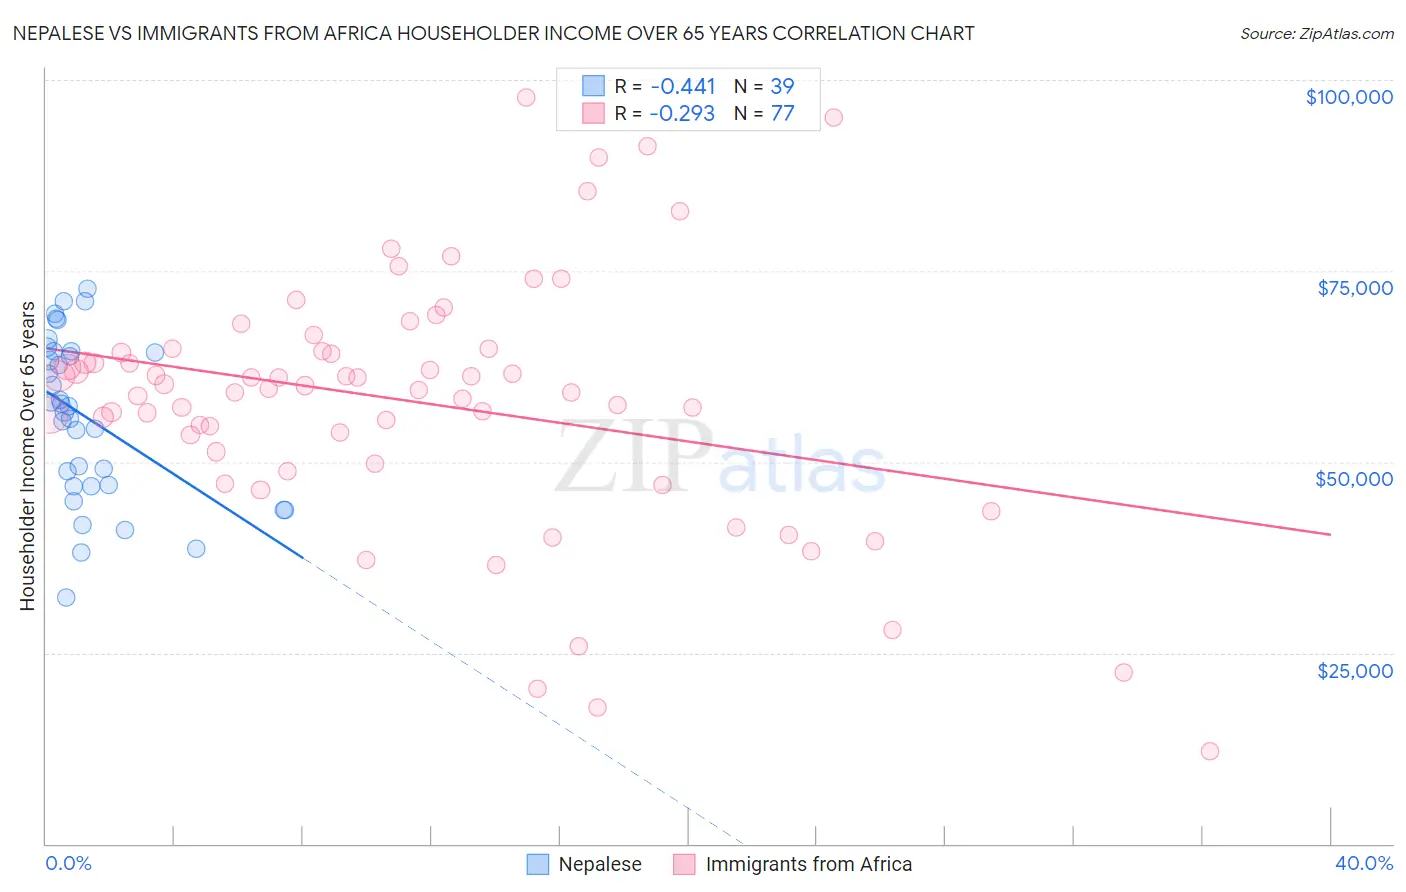
Nepalese vs Immigrants from Africa Householder Income Over 65 years Correlation Chart
The statistical analysis conducted on geographies consisting of 24,501,136 people shows a moderate negative correlation between the proportion of Nepalese and household income with householder over the age of 65 in the United States with a correlation coefficient (R) of -0.441 and weighted average of $58,761. Similarly, the statistical analysis conducted on geographies consisting of 467,079,806 people shows a weak negative correlation between the proportion of Immigrants from Africa and household income with householder over the age of 65 in the United States with a correlation coefficient (R) of -0.293 and weighted average of $59,837, a difference of 1.8%.
Householder Income Over 65 years Correlation Summary
| Measurement | Nepalese | Immigrants from Africa |
| Minimum | $32,174 | $12,049 |
| Maximum | $72,725 | $97,634 |
| Range | $40,551 | $85,585 |
| Mean | $55,785 | $57,866 |
| Median | $57,344 | $59,642 |
| Interquartile 25% (IQ1) | $46,756 | $50,510 |
| Interquartile 75% (IQ3) | $64,405 | $64,593 |
| Interquartile Range (IQR) | $17,649 | $14,083 |
| Standard Deviation (Sample) | $10,626 | $16,597 |
| Standard Deviation (Population) | $10,489 | $16,489 |
Demographics Similar to Nepalese and Immigrants from Africa by Householder Income Over 65 years
In terms of householder income over 65 years, the demographic groups most similar to Nepalese are Colombian ($58,851, a difference of 0.15%), White/Caucasian ($58,847, a difference of 0.15%), Immigrants from Nigeria ($58,942, a difference of 0.31%), Nigerian ($58,992, a difference of 0.39%), and Slovak ($59,039, a difference of 0.47%). Similarly, the demographic groups most similar to Immigrants from Africa are Immigrants from Iraq ($59,824, a difference of 0.020%), German ($59,730, a difference of 0.18%), Immigrants from Kenya ($59,710, a difference of 0.21%), Moroccan ($59,683, a difference of 0.26%), and Immigrants ($59,656, a difference of 0.30%).
| Demographics | Rating | Rank | Householder Income Over 65 years |
| Immigrants | Africa | 23.4 /100 | #194 | Fair $59,837 |
| Immigrants | Iraq | 23.2 /100 | #195 | Fair $59,824 |
| Germans | 21.5 /100 | #196 | Fair $59,730 |
| Immigrants | Kenya | 21.1 /100 | #197 | Fair $59,710 |
| Moroccans | 20.7 /100 | #198 | Fair $59,683 |
| Immigrants | Immigrants | 20.2 /100 | #199 | Fair $59,656 |
| French | 20.2 /100 | #200 | Fair $59,656 |
| Dutch | 18.3 /100 | #201 | Poor $59,539 |
| Finns | 18.2 /100 | #202 | Poor $59,535 |
| Scotch-Irish | 16.9 /100 | #203 | Poor $59,447 |
| Arapaho | 16.0 /100 | #204 | Poor $59,383 |
| Immigrants | Sudan | 14.2 /100 | #205 | Poor $59,248 |
| Immigrants | South America | 13.0 /100 | #206 | Poor $59,151 |
| Salvadorans | 12.9 /100 | #207 | Poor $59,141 |
| Uruguayans | 12.3 /100 | #208 | Poor $59,090 |
| Slovaks | 11.7 /100 | #209 | Poor $59,039 |
| Nigerians | 11.2 /100 | #210 | Poor $58,992 |
| Immigrants | Nigeria | 10.7 /100 | #211 | Poor $58,942 |
| Colombians | 9.8 /100 | #212 | Tragic $58,851 |
| Whites/Caucasians | 9.8 /100 | #213 | Tragic $58,847 |
| Nepalese | 9.0 /100 | #214 | Tragic $58,761 |