Scotch-Irish vs Immigrants from Costa Rica Median Family Income
COMPARE
Scotch-Irish
Immigrants from Costa Rica
Median Family Income
Median Family Income Comparison
Scotch-Irish
Immigrants from Costa Rica
$99,591
MEDIAN FAMILY INCOME
17.1/ 100
METRIC RATING
203rd/ 347
METRIC RANK
$101,354
MEDIAN FAMILY INCOME
33.7/ 100
METRIC RATING
184th/ 347
METRIC RANK
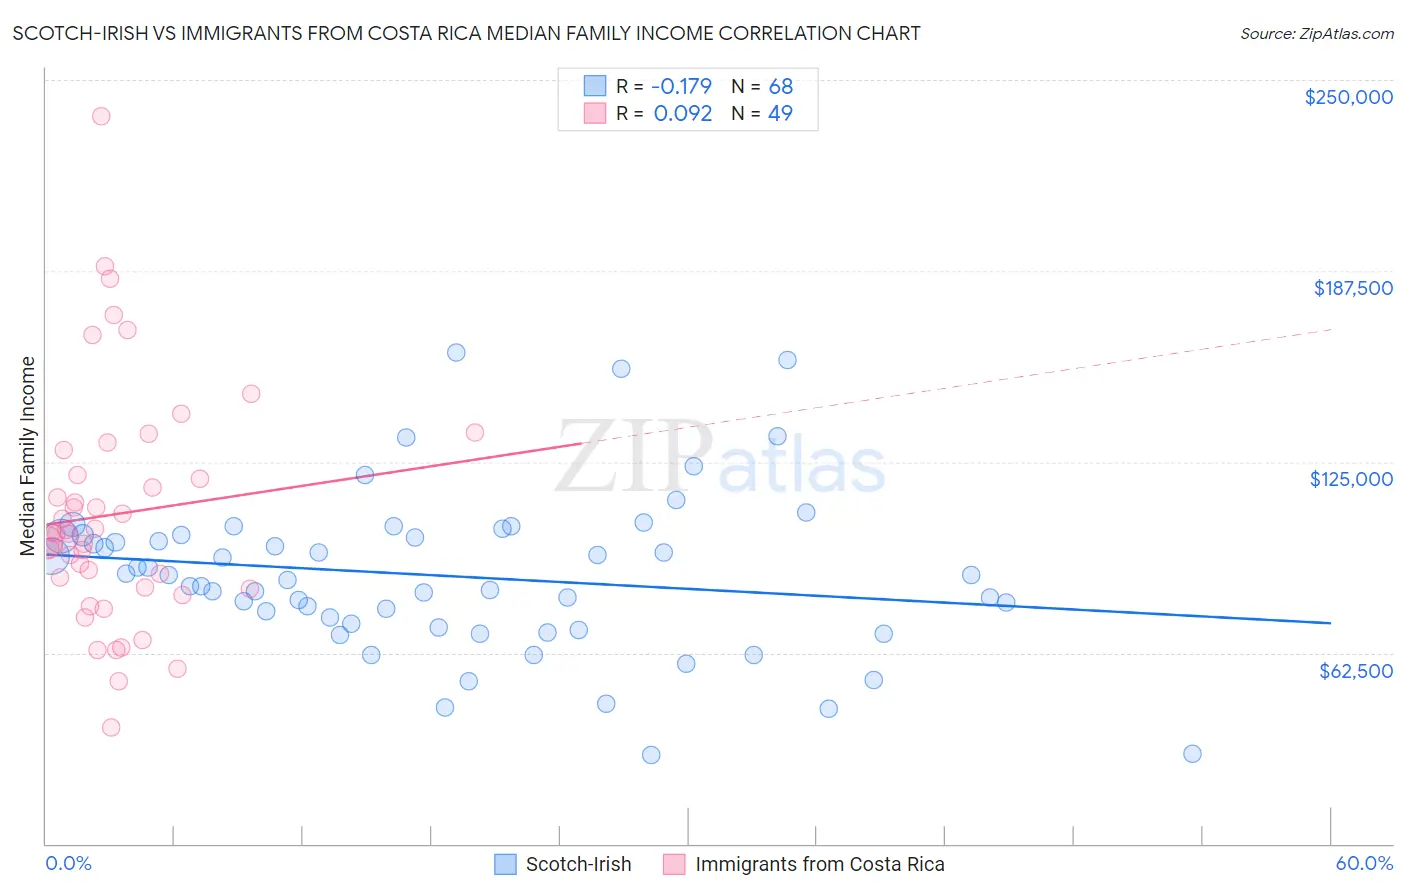
Scotch-Irish vs Immigrants from Costa Rica Median Family Income Correlation Chart
The statistical analysis conducted on geographies consisting of 547,821,252 people shows a poor negative correlation between the proportion of Scotch-Irish and median family income in the United States with a correlation coefficient (R) of -0.179 and weighted average of $99,591. Similarly, the statistical analysis conducted on geographies consisting of 204,217,887 people shows a slight positive correlation between the proportion of Immigrants from Costa Rica and median family income in the United States with a correlation coefficient (R) of 0.092 and weighted average of $101,354, a difference of 1.8%.
Median Family Income Correlation Summary
| Measurement | Scotch-Irish | Immigrants from Costa Rica |
| Minimum | $29,091 | $37,917 |
| Maximum | $160,619 | $238,052 |
| Range | $131,528 | $200,135 |
| Mean | $87,675 | $107,880 |
| Median | $87,122 | $101,496 |
| Interquartile 25% (IQ1) | $71,348 | $83,552 |
| Interquartile 75% (IQ3) | $100,856 | $124,823 |
| Interquartile Range (IQR) | $29,508 | $41,271 |
| Standard Deviation (Sample) | $26,299 | $38,589 |
| Standard Deviation (Population) | $26,105 | $38,194 |
Demographics Similar to Scotch-Irish and Immigrants from Costa Rica by Median Family Income
In terms of median family income, the demographic groups most similar to Scotch-Irish are White/Caucasian ($99,800, a difference of 0.21%), Immigrants from Thailand ($99,840, a difference of 0.25%), Spanish ($99,977, a difference of 0.39%), Yugoslavian ($100,119, a difference of 0.53%), and Immigrants from Africa ($100,256, a difference of 0.67%). Similarly, the demographic groups most similar to Immigrants from Costa Rica are Kenyan ($101,417, a difference of 0.060%), Dutch ($101,192, a difference of 0.16%), Celtic ($101,139, a difference of 0.21%), Tlingit-Haida ($101,092, a difference of 0.26%), and Guamanian/Chamorro ($101,061, a difference of 0.29%).
| Demographics | Rating | Rank | Median Family Income |
| Kenyans | 34.5 /100 | #183 | Fair $101,417 |
| Immigrants | Costa Rica | 33.7 /100 | #184 | Fair $101,354 |
| Dutch | 31.9 /100 | #185 | Fair $101,192 |
| Celtics | 31.3 /100 | #186 | Fair $101,139 |
| Tlingit-Haida | 30.8 /100 | #187 | Fair $101,092 |
| Guamanians/Chamorros | 30.5 /100 | #188 | Fair $101,061 |
| Immigrants | Portugal | 29.6 /100 | #189 | Fair $100,984 |
| Immigrants | Immigrants | 29.4 /100 | #190 | Fair $100,962 |
| Colombians | 27.2 /100 | #191 | Fair $100,750 |
| Immigrants | Kenya | 26.5 /100 | #192 | Fair $100,679 |
| Iraqis | 26.3 /100 | #193 | Fair $100,658 |
| Uruguayans | 26.3 /100 | #194 | Fair $100,656 |
| Immigrants | South America | 23.9 /100 | #195 | Fair $100,414 |
| Samoans | 23.3 /100 | #196 | Fair $100,344 |
| Immigrants | Cameroon | 22.8 /100 | #197 | Fair $100,289 |
| Immigrants | Africa | 22.5 /100 | #198 | Fair $100,256 |
| Yugoslavians | 21.3 /100 | #199 | Fair $100,119 |
| Spanish | 20.1 /100 | #200 | Fair $99,977 |
| Immigrants | Thailand | 19.0 /100 | #201 | Poor $99,840 |
| Whites/Caucasians | 18.7 /100 | #202 | Poor $99,800 |
| Scotch-Irish | 17.1 /100 | #203 | Poor $99,591 |