Scotch-Irish vs Immigrants from Lebanon Median Family Income
COMPARE
Scotch-Irish
Immigrants from Lebanon
Median Family Income
Median Family Income Comparison
Scotch-Irish
Immigrants from Lebanon
$99,591
MEDIAN FAMILY INCOME
17.1/ 100
METRIC RATING
203rd/ 347
METRIC RANK
$110,159
MEDIAN FAMILY INCOME
97.9/ 100
METRIC RATING
92nd/ 347
METRIC RANK
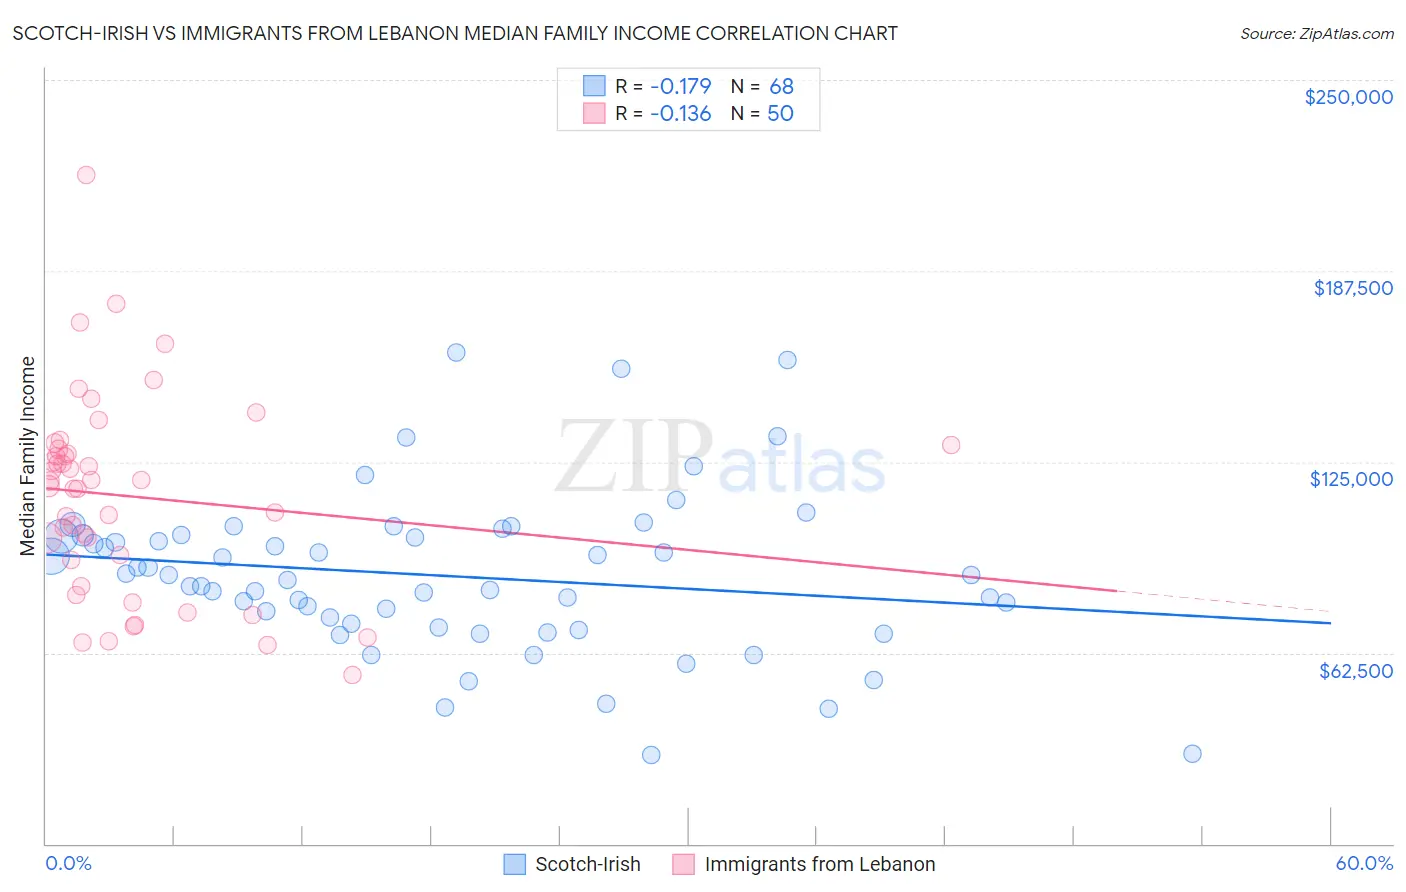
Scotch-Irish vs Immigrants from Lebanon Median Family Income Correlation Chart
The statistical analysis conducted on geographies consisting of 547,821,252 people shows a poor negative correlation between the proportion of Scotch-Irish and median family income in the United States with a correlation coefficient (R) of -0.179 and weighted average of $99,591. Similarly, the statistical analysis conducted on geographies consisting of 217,094,496 people shows a poor negative correlation between the proportion of Immigrants from Lebanon and median family income in the United States with a correlation coefficient (R) of -0.136 and weighted average of $110,159, a difference of 10.6%.
Median Family Income Correlation Summary
| Measurement | Scotch-Irish | Immigrants from Lebanon |
| Minimum | $29,091 | $55,430 |
| Maximum | $160,619 | $218,700 |
| Range | $131,528 | $163,270 |
| Mean | $87,675 | $113,756 |
| Median | $87,122 | $117,906 |
| Interquartile 25% (IQ1) | $71,348 | $93,082 |
| Interquartile 75% (IQ3) | $100,856 | $129,106 |
| Interquartile Range (IQR) | $29,508 | $36,025 |
| Standard Deviation (Sample) | $26,299 | $32,559 |
| Standard Deviation (Population) | $26,105 | $32,232 |
Similar Demographics by Median Family Income
Demographics Similar to Scotch-Irish by Median Family Income
In terms of median family income, the demographic groups most similar to Scotch-Irish are White/Caucasian ($99,800, a difference of 0.21%), Immigrants from Thailand ($99,840, a difference of 0.25%), Spanish ($99,977, a difference of 0.39%), Yugoslavian ($100,119, a difference of 0.53%), and Immigrants from Africa ($100,256, a difference of 0.67%).
| Demographics | Rating | Rank | Median Family Income |
| Samoans | 23.3 /100 | #196 | Fair $100,344 |
| Immigrants | Cameroon | 22.8 /100 | #197 | Fair $100,289 |
| Immigrants | Africa | 22.5 /100 | #198 | Fair $100,256 |
| Yugoslavians | 21.3 /100 | #199 | Fair $100,119 |
| Spanish | 20.1 /100 | #200 | Fair $99,977 |
| Immigrants | Thailand | 19.0 /100 | #201 | Poor $99,840 |
| Whites/Caucasians | 18.7 /100 | #202 | Poor $99,800 |
| Scotch-Irish | 17.1 /100 | #203 | Poor $99,591 |
| Ghanaians | 12.6 /100 | #204 | Poor $98,877 |
| Hawaiians | 12.5 /100 | #205 | Poor $98,869 |
| Immigrants | Iraq | 12.1 /100 | #206 | Poor $98,786 |
| Aleuts | 11.6 /100 | #207 | Poor $98,702 |
| Immigrants | Uruguay | 9.2 /100 | #208 | Tragic $98,205 |
| Immigrants | Colombia | 8.7 /100 | #209 | Tragic $98,067 |
| Puget Sound Salish | 8.2 /100 | #210 | Tragic $97,958 |
Demographics Similar to Immigrants from Lebanon by Median Family Income
In terms of median family income, the demographic groups most similar to Immigrants from Lebanon are Immigrants from Kazakhstan ($110,137, a difference of 0.020%), Korean ($110,103, a difference of 0.050%), Zimbabwean ($110,011, a difference of 0.13%), Immigrants from Moldova ($109,975, a difference of 0.17%), and Jordanian ($109,865, a difference of 0.27%).
| Demographics | Rating | Rank | Median Family Income |
| Croatians | 98.8 /100 | #85 | Exceptional $111,370 |
| Ukrainians | 98.8 /100 | #86 | Exceptional $111,368 |
| Austrians | 98.8 /100 | #87 | Exceptional $111,306 |
| Romanians | 98.8 /100 | #88 | Exceptional $111,243 |
| Immigrants | Argentina | 98.5 /100 | #89 | Exceptional $110,873 |
| Northern Europeans | 98.3 /100 | #90 | Exceptional $110,635 |
| Immigrants | Southern Europe | 98.3 /100 | #91 | Exceptional $110,614 |
| Immigrants | Lebanon | 97.9 /100 | #92 | Exceptional $110,159 |
| Immigrants | Kazakhstan | 97.8 /100 | #93 | Exceptional $110,137 |
| Koreans | 97.8 /100 | #94 | Exceptional $110,103 |
| Zimbabweans | 97.7 /100 | #95 | Exceptional $110,011 |
| Immigrants | Moldova | 97.7 /100 | #96 | Exceptional $109,975 |
| Jordanians | 97.5 /100 | #97 | Exceptional $109,865 |
| Immigrants | Kuwait | 97.4 /100 | #98 | Exceptional $109,731 |
| Armenians | 97.3 /100 | #99 | Exceptional $109,692 |