Scotch-Irish vs Immigrants from Lithuania Median Family Income
COMPARE
Scotch-Irish
Immigrants from Lithuania
Median Family Income
Median Family Income Comparison
Scotch-Irish
Immigrants from Lithuania
$99,591
MEDIAN FAMILY INCOME
17.1/ 100
METRIC RATING
203rd/ 347
METRIC RANK
$118,053
MEDIAN FAMILY INCOME
100.0/ 100
METRIC RATING
40th/ 347
METRIC RANK
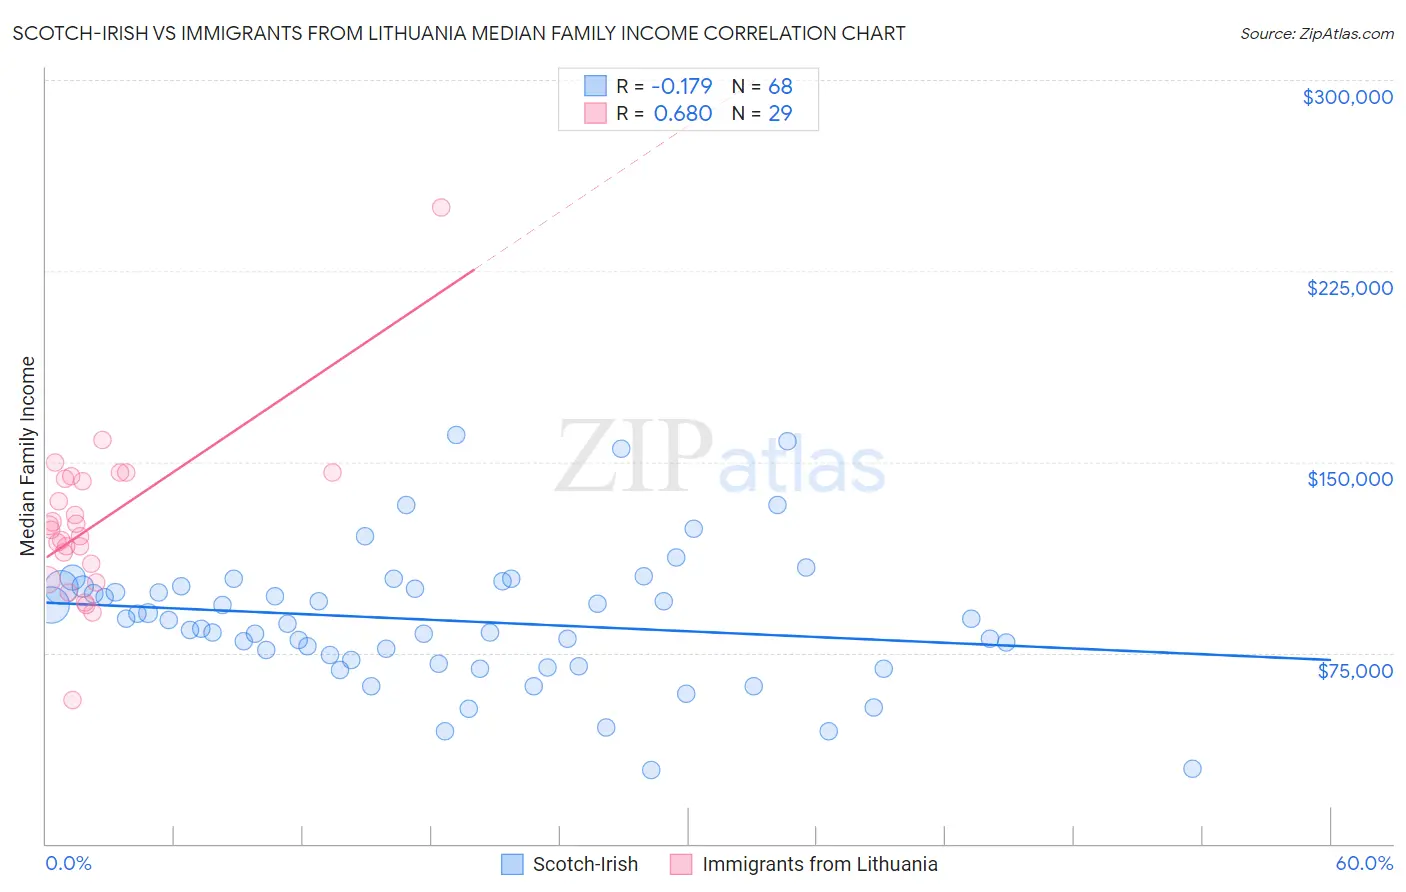
Scotch-Irish vs Immigrants from Lithuania Median Family Income Correlation Chart
The statistical analysis conducted on geographies consisting of 547,821,252 people shows a poor negative correlation between the proportion of Scotch-Irish and median family income in the United States with a correlation coefficient (R) of -0.179 and weighted average of $99,591. Similarly, the statistical analysis conducted on geographies consisting of 117,713,415 people shows a significant positive correlation between the proportion of Immigrants from Lithuania and median family income in the United States with a correlation coefficient (R) of 0.680 and weighted average of $118,053, a difference of 18.5%.
Median Family Income Correlation Summary
| Measurement | Scotch-Irish | Immigrants from Lithuania |
| Minimum | $29,091 | $56,363 |
| Maximum | $160,619 | $250,001 |
| Range | $131,528 | $193,638 |
| Mean | $87,675 | $125,785 |
| Median | $87,122 | $123,201 |
| Interquartile 25% (IQ1) | $71,348 | $106,762 |
| Interquartile 75% (IQ3) | $100,856 | $143,837 |
| Interquartile Range (IQR) | $29,508 | $37,076 |
| Standard Deviation (Sample) | $26,299 | $32,594 |
| Standard Deviation (Population) | $26,105 | $32,027 |
Similar Demographics by Median Family Income
Demographics Similar to Scotch-Irish by Median Family Income
In terms of median family income, the demographic groups most similar to Scotch-Irish are White/Caucasian ($99,800, a difference of 0.21%), Immigrants from Thailand ($99,840, a difference of 0.25%), Spanish ($99,977, a difference of 0.39%), Yugoslavian ($100,119, a difference of 0.53%), and Immigrants from Africa ($100,256, a difference of 0.67%).
| Demographics | Rating | Rank | Median Family Income |
| Samoans | 23.3 /100 | #196 | Fair $100,344 |
| Immigrants | Cameroon | 22.8 /100 | #197 | Fair $100,289 |
| Immigrants | Africa | 22.5 /100 | #198 | Fair $100,256 |
| Yugoslavians | 21.3 /100 | #199 | Fair $100,119 |
| Spanish | 20.1 /100 | #200 | Fair $99,977 |
| Immigrants | Thailand | 19.0 /100 | #201 | Poor $99,840 |
| Whites/Caucasians | 18.7 /100 | #202 | Poor $99,800 |
| Scotch-Irish | 17.1 /100 | #203 | Poor $99,591 |
| Ghanaians | 12.6 /100 | #204 | Poor $98,877 |
| Hawaiians | 12.5 /100 | #205 | Poor $98,869 |
| Immigrants | Iraq | 12.1 /100 | #206 | Poor $98,786 |
| Aleuts | 11.6 /100 | #207 | Poor $98,702 |
| Immigrants | Uruguay | 9.2 /100 | #208 | Tragic $98,205 |
| Immigrants | Colombia | 8.7 /100 | #209 | Tragic $98,067 |
| Puget Sound Salish | 8.2 /100 | #210 | Tragic $97,958 |
Demographics Similar to Immigrants from Lithuania by Median Family Income
In terms of median family income, the demographic groups most similar to Immigrants from Lithuania are Estonian ($118,013, a difference of 0.030%), Immigrants from Bolivia ($117,912, a difference of 0.12%), Immigrants from Asia ($118,291, a difference of 0.20%), Bulgarian ($117,818, a difference of 0.20%), and Immigrants from Turkey ($118,325, a difference of 0.23%).
| Demographics | Rating | Rank | Median Family Income |
| Bhutanese | 100.0 /100 | #33 | Exceptional $119,800 |
| Bolivians | 100.0 /100 | #34 | Exceptional $119,479 |
| Soviet Union | 100.0 /100 | #35 | Exceptional $119,262 |
| Israelis | 100.0 /100 | #36 | Exceptional $118,577 |
| Australians | 100.0 /100 | #37 | Exceptional $118,440 |
| Immigrants | Turkey | 100.0 /100 | #38 | Exceptional $118,325 |
| Immigrants | Asia | 100.0 /100 | #39 | Exceptional $118,291 |
| Immigrants | Lithuania | 100.0 /100 | #40 | Exceptional $118,053 |
| Estonians | 100.0 /100 | #41 | Exceptional $118,013 |
| Immigrants | Bolivia | 100.0 /100 | #42 | Exceptional $117,912 |
| Bulgarians | 100.0 /100 | #43 | Exceptional $117,818 |
| Cambodians | 100.0 /100 | #44 | Exceptional $117,780 |
| Immigrants | Greece | 99.9 /100 | #45 | Exceptional $117,344 |
| Immigrants | Russia | 99.9 /100 | #46 | Exceptional $116,942 |
| Immigrants | Austria | 99.9 /100 | #47 | Exceptional $116,830 |