Scotch-Irish vs Immigrants from Northern Africa Median Family Income
COMPARE
Scotch-Irish
Immigrants from Northern Africa
Median Family Income
Median Family Income Comparison
Scotch-Irish
Immigrants from Northern Africa
$99,591
MEDIAN FAMILY INCOME
17.1/ 100
METRIC RATING
203rd/ 347
METRIC RANK
$108,161
MEDIAN FAMILY INCOME
94.3/ 100
METRIC RATING
120th/ 347
METRIC RANK
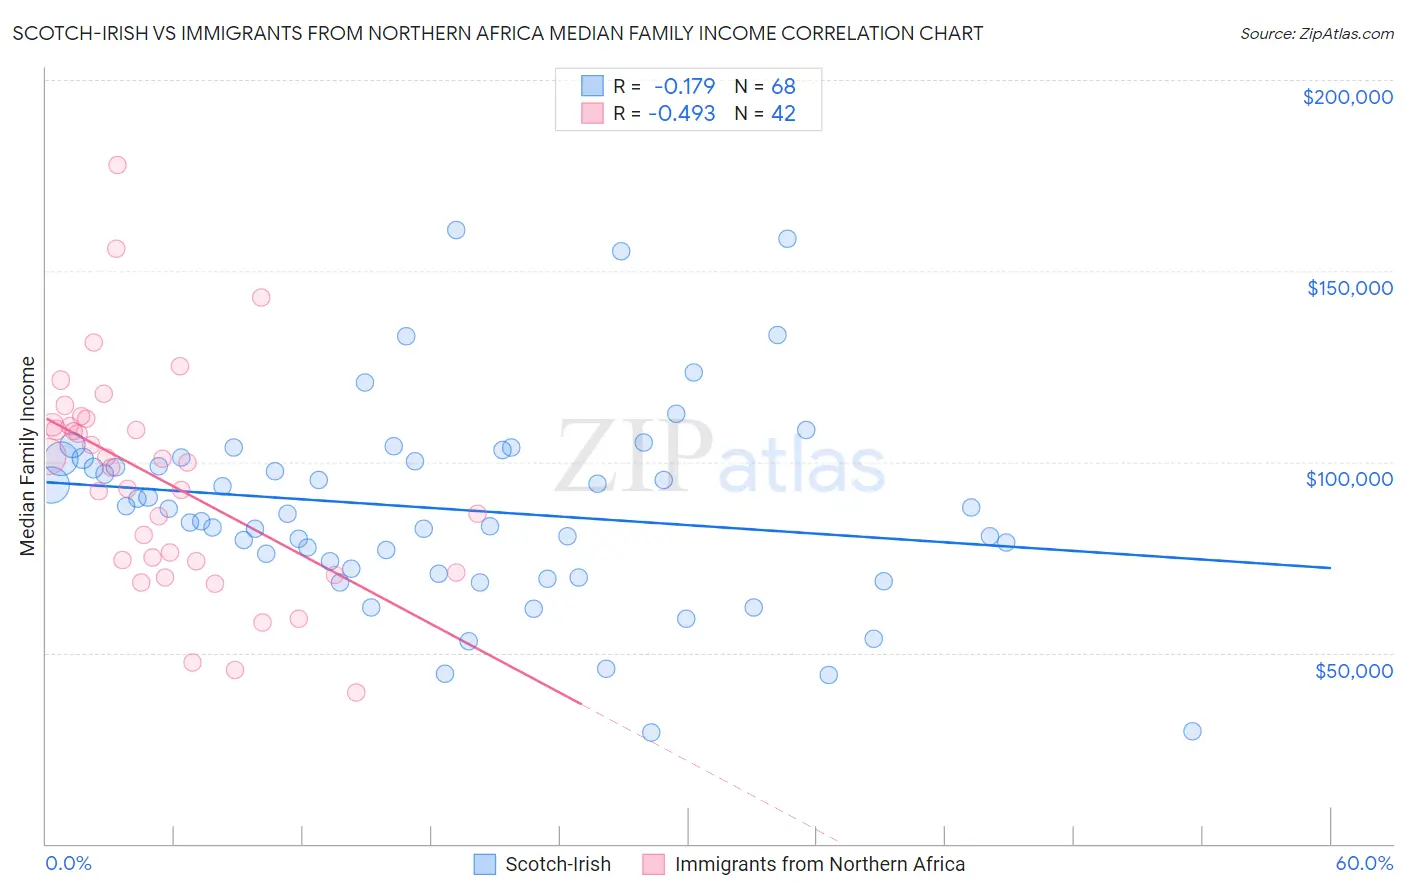
Scotch-Irish vs Immigrants from Northern Africa Median Family Income Correlation Chart
The statistical analysis conducted on geographies consisting of 547,821,252 people shows a poor negative correlation between the proportion of Scotch-Irish and median family income in the United States with a correlation coefficient (R) of -0.179 and weighted average of $99,591. Similarly, the statistical analysis conducted on geographies consisting of 321,028,181 people shows a moderate negative correlation between the proportion of Immigrants from Northern Africa and median family income in the United States with a correlation coefficient (R) of -0.493 and weighted average of $108,161, a difference of 8.6%.
Median Family Income Correlation Summary
| Measurement | Scotch-Irish | Immigrants from Northern Africa |
| Minimum | $29,091 | $39,712 |
| Maximum | $160,619 | $177,697 |
| Range | $131,528 | $137,985 |
| Mean | $87,675 | $95,107 |
| Median | $87,122 | $99,249 |
| Interquartile 25% (IQ1) | $71,348 | $74,063 |
| Interquartile 75% (IQ3) | $100,856 | $109,687 |
| Interquartile Range (IQR) | $29,508 | $35,624 |
| Standard Deviation (Sample) | $26,299 | $28,923 |
| Standard Deviation (Population) | $26,105 | $28,576 |
Similar Demographics by Median Family Income
Demographics Similar to Scotch-Irish by Median Family Income
In terms of median family income, the demographic groups most similar to Scotch-Irish are White/Caucasian ($99,800, a difference of 0.21%), Immigrants from Thailand ($99,840, a difference of 0.25%), Spanish ($99,977, a difference of 0.39%), Yugoslavian ($100,119, a difference of 0.53%), and Immigrants from Africa ($100,256, a difference of 0.67%).
| Demographics | Rating | Rank | Median Family Income |
| Samoans | 23.3 /100 | #196 | Fair $100,344 |
| Immigrants | Cameroon | 22.8 /100 | #197 | Fair $100,289 |
| Immigrants | Africa | 22.5 /100 | #198 | Fair $100,256 |
| Yugoslavians | 21.3 /100 | #199 | Fair $100,119 |
| Spanish | 20.1 /100 | #200 | Fair $99,977 |
| Immigrants | Thailand | 19.0 /100 | #201 | Poor $99,840 |
| Whites/Caucasians | 18.7 /100 | #202 | Poor $99,800 |
| Scotch-Irish | 17.1 /100 | #203 | Poor $99,591 |
| Ghanaians | 12.6 /100 | #204 | Poor $98,877 |
| Hawaiians | 12.5 /100 | #205 | Poor $98,869 |
| Immigrants | Iraq | 12.1 /100 | #206 | Poor $98,786 |
| Aleuts | 11.6 /100 | #207 | Poor $98,702 |
| Immigrants | Uruguay | 9.2 /100 | #208 | Tragic $98,205 |
| Immigrants | Colombia | 8.7 /100 | #209 | Tragic $98,067 |
| Puget Sound Salish | 8.2 /100 | #210 | Tragic $97,958 |
Demographics Similar to Immigrants from Northern Africa by Median Family Income
In terms of median family income, the demographic groups most similar to Immigrants from Northern Africa are European ($108,099, a difference of 0.060%), Sri Lankan ($108,234, a difference of 0.070%), Ethiopian ($108,251, a difference of 0.080%), Immigrants from Philippines ($108,288, a difference of 0.12%), and Chilean ($108,429, a difference of 0.25%).
| Demographics | Rating | Rank | Median Family Income |
| Immigrants | Saudi Arabia | 95.2 /100 | #113 | Exceptional $108,544 |
| Poles | 95.2 /100 | #114 | Exceptional $108,507 |
| Swedes | 95.1 /100 | #115 | Exceptional $108,499 |
| Chileans | 95.0 /100 | #116 | Exceptional $108,429 |
| Immigrants | Philippines | 94.6 /100 | #117 | Exceptional $108,288 |
| Ethiopians | 94.5 /100 | #118 | Exceptional $108,251 |
| Sri Lankans | 94.5 /100 | #119 | Exceptional $108,234 |
| Immigrants | Northern Africa | 94.3 /100 | #120 | Exceptional $108,161 |
| Europeans | 94.1 /100 | #121 | Exceptional $108,099 |
| Immigrants | Jordan | 92.9 /100 | #122 | Exceptional $107,715 |
| Carpatho Rusyns | 92.2 /100 | #123 | Exceptional $107,502 |
| Pakistanis | 91.7 /100 | #124 | Exceptional $107,390 |
| Taiwanese | 91.4 /100 | #125 | Exceptional $107,295 |
| Serbians | 90.8 /100 | #126 | Exceptional $107,157 |
| Lebanese | 90.5 /100 | #127 | Exceptional $107,086 |