British vs Brazilian Median Family Income
COMPARE
British
Brazilian
Median Family Income
Median Family Income Comparison
British
Brazilians
$108,705
MEDIAN FAMILY INCOME
95.6/ 100
METRIC RATING
110th/ 347
METRIC RANK
$106,942
MEDIAN FAMILY INCOME
89.8/ 100
METRIC RATING
130th/ 347
METRIC RANK
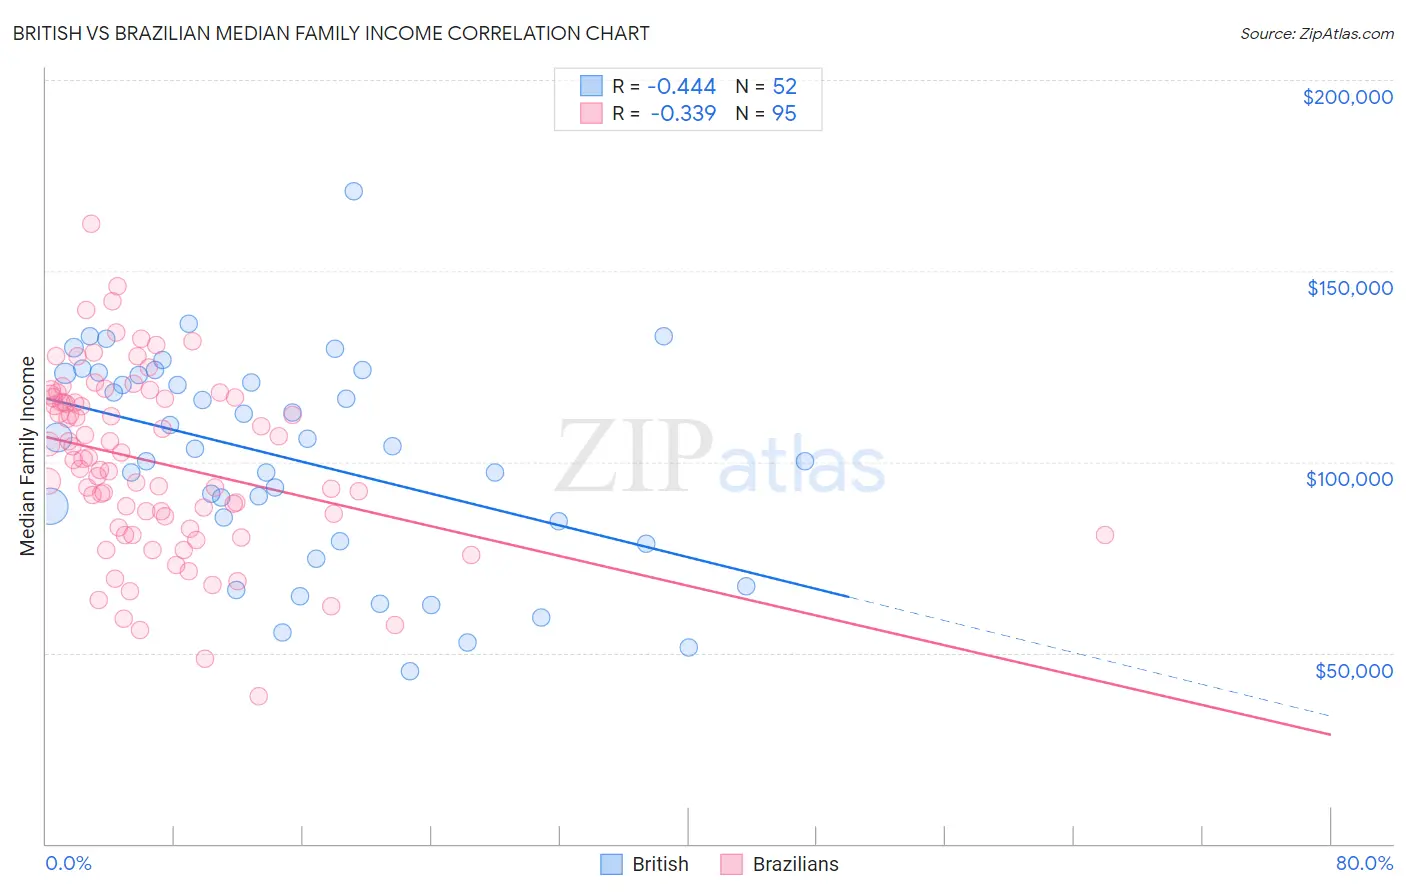
British vs Brazilian Median Family Income Correlation Chart
The statistical analysis conducted on geographies consisting of 530,672,110 people shows a moderate negative correlation between the proportion of British and median family income in the United States with a correlation coefficient (R) of -0.444 and weighted average of $108,705. Similarly, the statistical analysis conducted on geographies consisting of 323,618,722 people shows a mild negative correlation between the proportion of Brazilians and median family income in the United States with a correlation coefficient (R) of -0.339 and weighted average of $106,942, a difference of 1.7%.
Median Family Income Correlation Summary
| Measurement | British | Brazilian |
| Minimum | $45,060 | $38,641 |
| Maximum | $170,856 | $162,465 |
| Range | $125,796 | $123,824 |
| Mean | $100,714 | $99,932 |
| Median | $103,902 | $100,863 |
| Interquartile 25% (IQ1) | $81,768 | $82,900 |
| Interquartile 75% (IQ3) | $123,002 | $116,816 |
| Interquartile Range (IQR) | $41,234 | $33,916 |
| Standard Deviation (Sample) | $27,270 | $23,225 |
| Standard Deviation (Population) | $27,007 | $23,102 |
Demographics Similar to British and Brazilians by Median Family Income
In terms of median family income, the demographic groups most similar to British are Immigrants from Western Asia ($108,691, a difference of 0.010%), Immigrants from Poland ($108,570, a difference of 0.12%), Immigrants from Saudi Arabia ($108,544, a difference of 0.15%), Polish ($108,507, a difference of 0.18%), and Swedish ($108,499, a difference of 0.19%). Similarly, the demographic groups most similar to Brazilians are Arab ($106,952, a difference of 0.010%), Immigrants from Ethiopia ($106,969, a difference of 0.030%), Lebanese ($107,086, a difference of 0.13%), Serbian ($107,157, a difference of 0.20%), and Taiwanese ($107,295, a difference of 0.33%).
| Demographics | Rating | Rank | Median Family Income |
| British | 95.6 /100 | #110 | Exceptional $108,705 |
| Immigrants | Western Asia | 95.6 /100 | #111 | Exceptional $108,691 |
| Immigrants | Poland | 95.3 /100 | #112 | Exceptional $108,570 |
| Immigrants | Saudi Arabia | 95.2 /100 | #113 | Exceptional $108,544 |
| Poles | 95.2 /100 | #114 | Exceptional $108,507 |
| Swedes | 95.1 /100 | #115 | Exceptional $108,499 |
| Chileans | 95.0 /100 | #116 | Exceptional $108,429 |
| Immigrants | Philippines | 94.6 /100 | #117 | Exceptional $108,288 |
| Ethiopians | 94.5 /100 | #118 | Exceptional $108,251 |
| Sri Lankans | 94.5 /100 | #119 | Exceptional $108,234 |
| Immigrants | Northern Africa | 94.3 /100 | #120 | Exceptional $108,161 |
| Europeans | 94.1 /100 | #121 | Exceptional $108,099 |
| Immigrants | Jordan | 92.9 /100 | #122 | Exceptional $107,715 |
| Carpatho Rusyns | 92.2 /100 | #123 | Exceptional $107,502 |
| Pakistanis | 91.7 /100 | #124 | Exceptional $107,390 |
| Taiwanese | 91.4 /100 | #125 | Exceptional $107,295 |
| Serbians | 90.8 /100 | #126 | Exceptional $107,157 |
| Lebanese | 90.5 /100 | #127 | Exceptional $107,086 |
| Immigrants | Ethiopia | 90.0 /100 | #128 | Excellent $106,969 |
| Arabs | 89.9 /100 | #129 | Excellent $106,952 |
| Brazilians | 89.8 /100 | #130 | Excellent $106,942 |