Scotch-Irish vs Immigrants from South Africa Median Family Income
COMPARE
Scotch-Irish
Immigrants from South Africa
Median Family Income
Median Family Income Comparison
Scotch-Irish
Immigrants from South Africa
$99,591
MEDIAN FAMILY INCOME
17.1/ 100
METRIC RATING
203rd/ 347
METRIC RANK
$116,286
MEDIAN FAMILY INCOME
99.9/ 100
METRIC RATING
48th/ 347
METRIC RANK
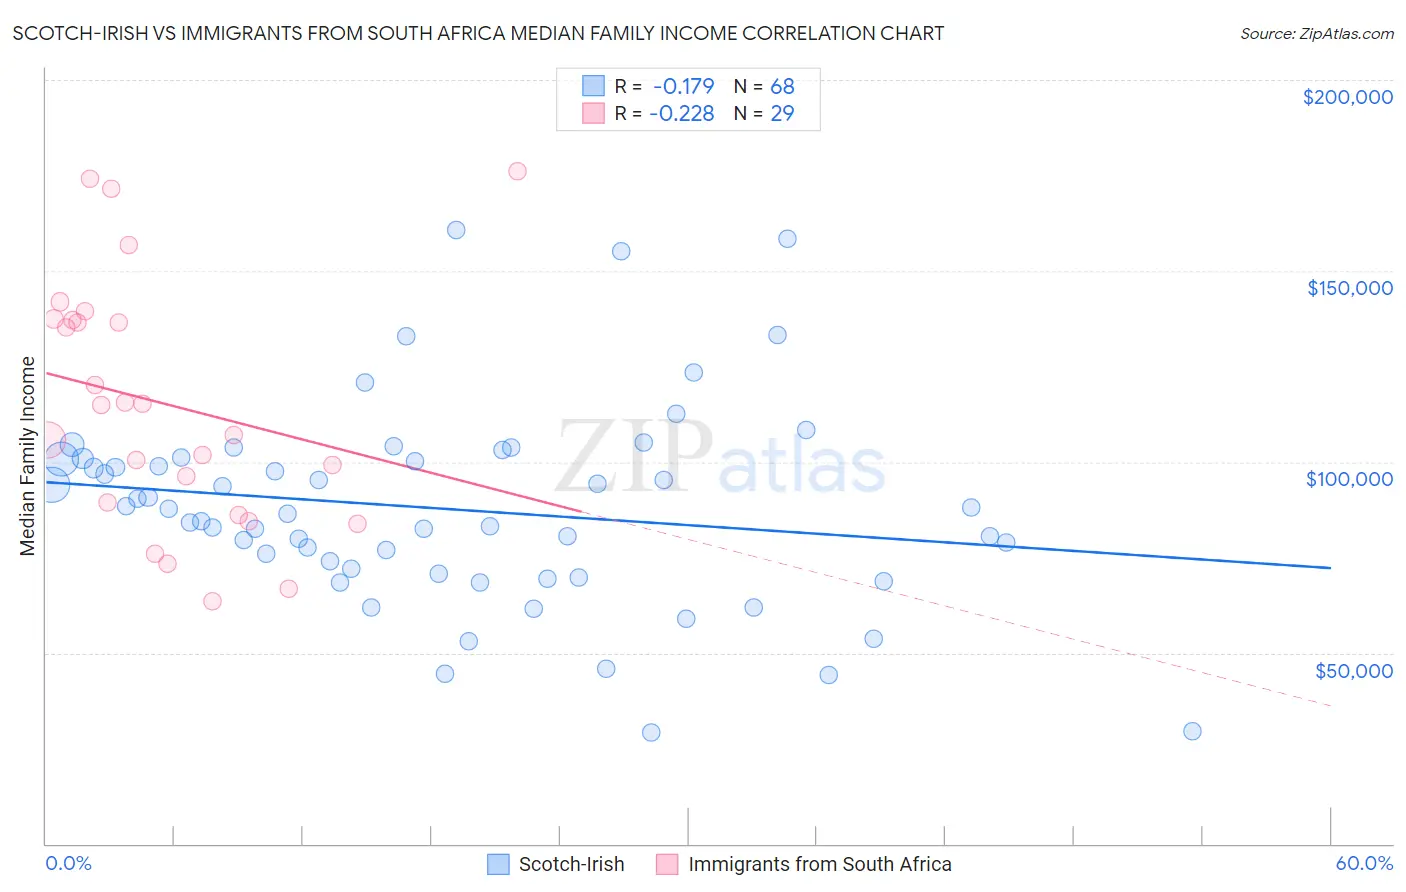
Scotch-Irish vs Immigrants from South Africa Median Family Income Correlation Chart
The statistical analysis conducted on geographies consisting of 547,821,252 people shows a poor negative correlation between the proportion of Scotch-Irish and median family income in the United States with a correlation coefficient (R) of -0.179 and weighted average of $99,591. Similarly, the statistical analysis conducted on geographies consisting of 233,253,527 people shows a weak negative correlation between the proportion of Immigrants from South Africa and median family income in the United States with a correlation coefficient (R) of -0.228 and weighted average of $116,286, a difference of 16.8%.
Median Family Income Correlation Summary
| Measurement | Scotch-Irish | Immigrants from South Africa |
| Minimum | $29,091 | $63,496 |
| Maximum | $160,619 | $176,195 |
| Range | $131,528 | $112,699 |
| Mean | $87,675 | $115,244 |
| Median | $87,122 | $114,820 |
| Interquartile 25% (IQ1) | $71,348 | $87,615 |
| Interquartile 75% (IQ3) | $100,856 | $137,250 |
| Interquartile Range (IQR) | $29,508 | $49,635 |
| Standard Deviation (Sample) | $26,299 | $31,957 |
| Standard Deviation (Population) | $26,105 | $31,402 |
Similar Demographics by Median Family Income
Demographics Similar to Scotch-Irish by Median Family Income
In terms of median family income, the demographic groups most similar to Scotch-Irish are White/Caucasian ($99,800, a difference of 0.21%), Immigrants from Thailand ($99,840, a difference of 0.25%), Spanish ($99,977, a difference of 0.39%), Yugoslavian ($100,119, a difference of 0.53%), and Immigrants from Africa ($100,256, a difference of 0.67%).
| Demographics | Rating | Rank | Median Family Income |
| Samoans | 23.3 /100 | #196 | Fair $100,344 |
| Immigrants | Cameroon | 22.8 /100 | #197 | Fair $100,289 |
| Immigrants | Africa | 22.5 /100 | #198 | Fair $100,256 |
| Yugoslavians | 21.3 /100 | #199 | Fair $100,119 |
| Spanish | 20.1 /100 | #200 | Fair $99,977 |
| Immigrants | Thailand | 19.0 /100 | #201 | Poor $99,840 |
| Whites/Caucasians | 18.7 /100 | #202 | Poor $99,800 |
| Scotch-Irish | 17.1 /100 | #203 | Poor $99,591 |
| Ghanaians | 12.6 /100 | #204 | Poor $98,877 |
| Hawaiians | 12.5 /100 | #205 | Poor $98,869 |
| Immigrants | Iraq | 12.1 /100 | #206 | Poor $98,786 |
| Aleuts | 11.6 /100 | #207 | Poor $98,702 |
| Immigrants | Uruguay | 9.2 /100 | #208 | Tragic $98,205 |
| Immigrants | Colombia | 8.7 /100 | #209 | Tragic $98,067 |
| Puget Sound Salish | 8.2 /100 | #210 | Tragic $97,958 |
Demographics Similar to Immigrants from South Africa by Median Family Income
In terms of median family income, the demographic groups most similar to Immigrants from South Africa are Chinese ($116,188, a difference of 0.080%), Immigrants from Czechoslovakia ($116,165, a difference of 0.10%), Immigrants from Malaysia ($115,880, a difference of 0.35%), Maltese ($115,862, a difference of 0.37%), and Immigrants from Norway ($115,847, a difference of 0.38%).
| Demographics | Rating | Rank | Median Family Income |
| Estonians | 100.0 /100 | #41 | Exceptional $118,013 |
| Immigrants | Bolivia | 100.0 /100 | #42 | Exceptional $117,912 |
| Bulgarians | 100.0 /100 | #43 | Exceptional $117,818 |
| Cambodians | 100.0 /100 | #44 | Exceptional $117,780 |
| Immigrants | Greece | 99.9 /100 | #45 | Exceptional $117,344 |
| Immigrants | Russia | 99.9 /100 | #46 | Exceptional $116,942 |
| Immigrants | Austria | 99.9 /100 | #47 | Exceptional $116,830 |
| Immigrants | South Africa | 99.9 /100 | #48 | Exceptional $116,286 |
| Chinese | 99.9 /100 | #49 | Exceptional $116,188 |
| Immigrants | Czechoslovakia | 99.9 /100 | #50 | Exceptional $116,165 |
| Immigrants | Malaysia | 99.9 /100 | #51 | Exceptional $115,880 |
| Maltese | 99.9 /100 | #52 | Exceptional $115,862 |
| Immigrants | Norway | 99.9 /100 | #53 | Exceptional $115,847 |
| Immigrants | Europe | 99.9 /100 | #54 | Exceptional $115,523 |
| Lithuanians | 99.8 /100 | #55 | Exceptional $115,395 |