Immigrants from St. Vincent and the Grenadines vs Brazilian Median Family Income
COMPARE
Immigrants from St. Vincent and the Grenadines
Brazilian
Median Family Income
Median Family Income Comparison
Immigrants from St. Vincent and the Grenadines
Brazilians
$90,094
MEDIAN FAMILY INCOME
0.2/ 100
METRIC RATING
275th/ 347
METRIC RANK
$106,942
MEDIAN FAMILY INCOME
89.8/ 100
METRIC RATING
130th/ 347
METRIC RANK
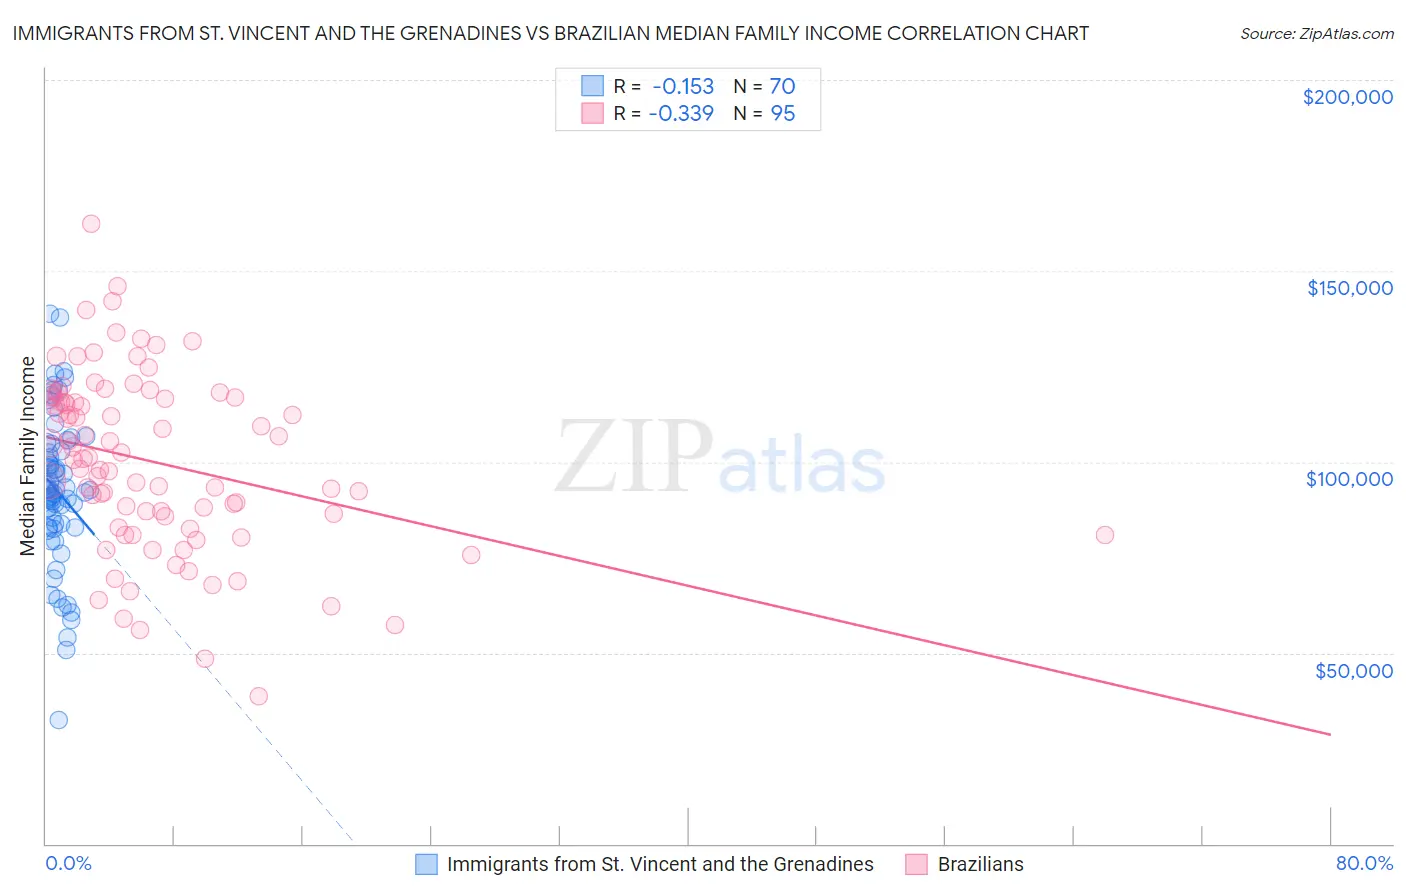
Immigrants from St. Vincent and the Grenadines vs Brazilian Median Family Income Correlation Chart
The statistical analysis conducted on geographies consisting of 56,186,074 people shows a poor negative correlation between the proportion of Immigrants from St. Vincent and the Grenadines and median family income in the United States with a correlation coefficient (R) of -0.153 and weighted average of $90,094. Similarly, the statistical analysis conducted on geographies consisting of 323,618,722 people shows a mild negative correlation between the proportion of Brazilians and median family income in the United States with a correlation coefficient (R) of -0.339 and weighted average of $106,942, a difference of 18.7%.
Median Family Income Correlation Summary
| Measurement | Immigrants from St. Vincent and the Grenadines | Brazilian |
| Minimum | $32,289 | $38,641 |
| Maximum | $138,717 | $162,465 |
| Range | $106,428 | $123,824 |
| Mean | $92,358 | $99,932 |
| Median | $92,624 | $100,863 |
| Interquartile 25% (IQ1) | $82,866 | $82,900 |
| Interquartile 75% (IQ3) | $102,687 | $116,816 |
| Interquartile Range (IQR) | $19,821 | $33,916 |
| Standard Deviation (Sample) | $19,859 | $23,225 |
| Standard Deviation (Population) | $19,717 | $23,102 |
Similar Demographics by Median Family Income
Demographics Similar to Immigrants from St. Vincent and the Grenadines by Median Family Income
In terms of median family income, the demographic groups most similar to Immigrants from St. Vincent and the Grenadines are Spanish American ($90,322, a difference of 0.25%), Immigrants from Micronesia ($90,345, a difference of 0.28%), Immigrants from Liberia ($90,450, a difference of 0.40%), Iroquois ($90,543, a difference of 0.50%), and Jamaican ($90,581, a difference of 0.54%).
| Demographics | Rating | Rank | Median Family Income |
| Cree | 0.2 /100 | #268 | Tragic $90,882 |
| Belizeans | 0.2 /100 | #269 | Tragic $90,880 |
| Jamaicans | 0.2 /100 | #270 | Tragic $90,581 |
| Iroquois | 0.2 /100 | #271 | Tragic $90,543 |
| Immigrants | Liberia | 0.2 /100 | #272 | Tragic $90,450 |
| Immigrants | Micronesia | 0.2 /100 | #273 | Tragic $90,345 |
| Spanish Americans | 0.2 /100 | #274 | Tragic $90,322 |
| Immigrants | St. Vincent and the Grenadines | 0.2 /100 | #275 | Tragic $90,094 |
| Immigrants | Zaire | 0.1 /100 | #276 | Tragic $89,285 |
| Immigrants | Jamaica | 0.1 /100 | #277 | Tragic $89,268 |
| Immigrants | Grenada | 0.1 /100 | #278 | Tragic $89,249 |
| Immigrants | Belize | 0.1 /100 | #279 | Tragic $89,197 |
| British West Indians | 0.1 /100 | #280 | Tragic $88,987 |
| Blackfeet | 0.1 /100 | #281 | Tragic $88,717 |
| Comanche | 0.1 /100 | #282 | Tragic $88,556 |
Demographics Similar to Brazilians by Median Family Income
In terms of median family income, the demographic groups most similar to Brazilians are Arab ($106,952, a difference of 0.010%), Immigrants from Ethiopia ($106,969, a difference of 0.030%), Lebanese ($107,086, a difference of 0.13%), Serbian ($107,157, a difference of 0.20%), and Canadian ($106,597, a difference of 0.32%).
| Demographics | Rating | Rank | Median Family Income |
| Carpatho Rusyns | 92.2 /100 | #123 | Exceptional $107,502 |
| Pakistanis | 91.7 /100 | #124 | Exceptional $107,390 |
| Taiwanese | 91.4 /100 | #125 | Exceptional $107,295 |
| Serbians | 90.8 /100 | #126 | Exceptional $107,157 |
| Lebanese | 90.5 /100 | #127 | Exceptional $107,086 |
| Immigrants | Ethiopia | 90.0 /100 | #128 | Excellent $106,969 |
| Arabs | 89.9 /100 | #129 | Excellent $106,952 |
| Brazilians | 89.8 /100 | #130 | Excellent $106,942 |
| Canadians | 88.1 /100 | #131 | Excellent $106,597 |
| Immigrants | Fiji | 87.8 /100 | #132 | Excellent $106,544 |
| Ugandans | 87.8 /100 | #133 | Excellent $106,541 |
| Immigrants | Oceania | 87.3 /100 | #134 | Excellent $106,453 |
| Portuguese | 86.3 /100 | #135 | Excellent $106,286 |
| Immigrants | South Eastern Asia | 86.1 /100 | #136 | Excellent $106,252 |
| Immigrants | Uganda | 85.7 /100 | #137 | Excellent $106,188 |