Scotch-Irish vs Immigrants from Ghana Median Family Income
COMPARE
Scotch-Irish
Immigrants from Ghana
Median Family Income
Median Family Income Comparison
Scotch-Irish
Immigrants from Ghana
$99,591
MEDIAN FAMILY INCOME
17.1/ 100
METRIC RATING
203rd/ 347
METRIC RANK
$96,544
MEDIAN FAMILY INCOME
4.2/ 100
METRIC RATING
221st/ 347
METRIC RANK
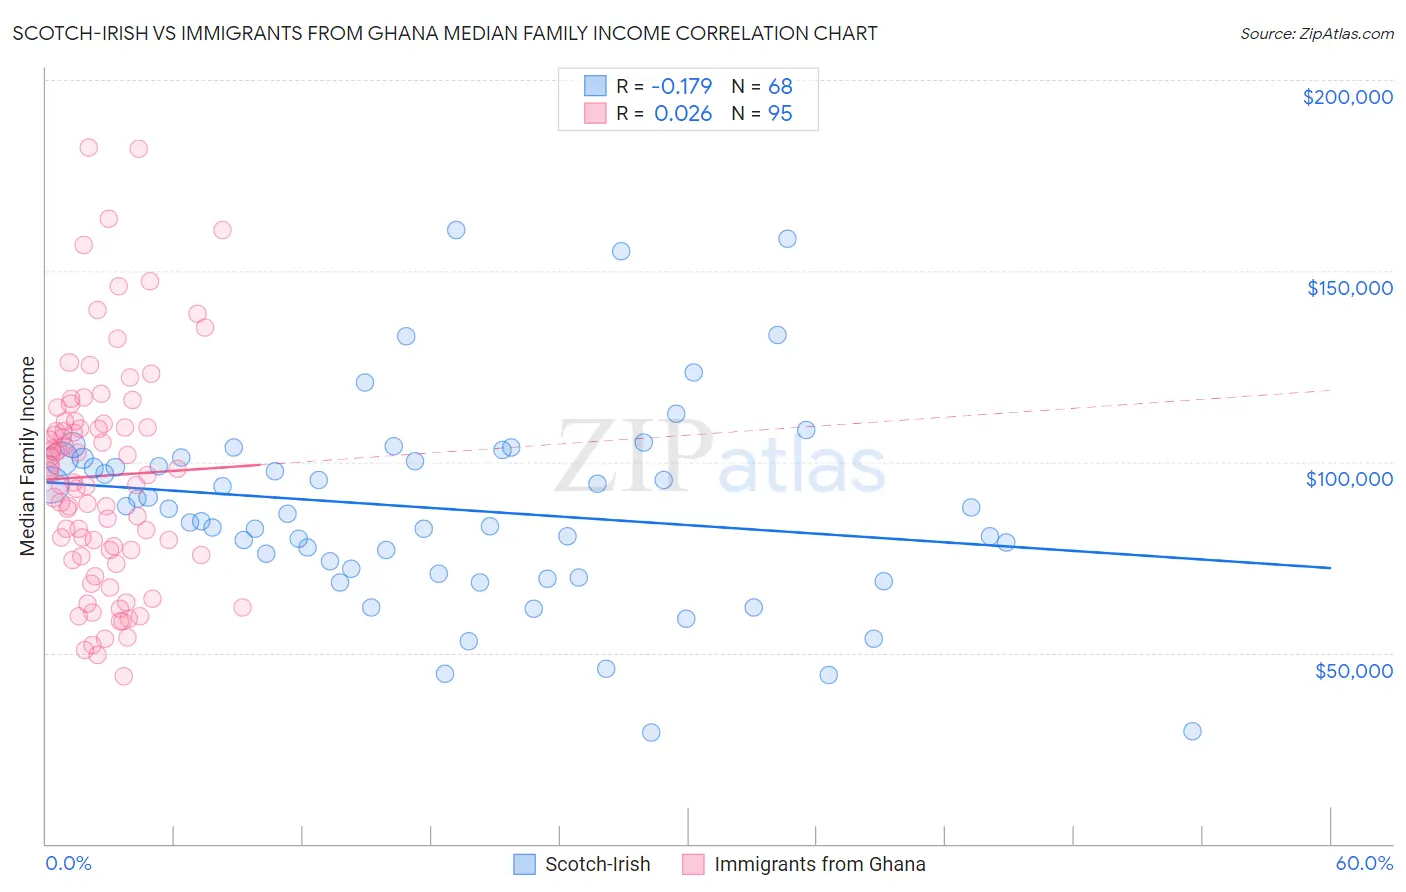
Scotch-Irish vs Immigrants from Ghana Median Family Income Correlation Chart
The statistical analysis conducted on geographies consisting of 547,821,252 people shows a poor negative correlation between the proportion of Scotch-Irish and median family income in the United States with a correlation coefficient (R) of -0.179 and weighted average of $99,591. Similarly, the statistical analysis conducted on geographies consisting of 199,771,663 people shows no correlation between the proportion of Immigrants from Ghana and median family income in the United States with a correlation coefficient (R) of 0.026 and weighted average of $96,544, a difference of 3.2%.
Median Family Income Correlation Summary
| Measurement | Scotch-Irish | Immigrants from Ghana |
| Minimum | $29,091 | $43,736 |
| Maximum | $160,619 | $182,203 |
| Range | $131,528 | $138,466 |
| Mean | $87,675 | $96,337 |
| Median | $87,122 | $96,719 |
| Interquartile 25% (IQ1) | $71,348 | $75,639 |
| Interquartile 75% (IQ3) | $100,856 | $110,050 |
| Interquartile Range (IQR) | $29,508 | $34,411 |
| Standard Deviation (Sample) | $26,299 | $29,276 |
| Standard Deviation (Population) | $26,105 | $29,122 |
Demographics Similar to Scotch-Irish and Immigrants from Ghana by Median Family Income
In terms of median family income, the demographic groups most similar to Scotch-Irish are White/Caucasian ($99,800, a difference of 0.21%), Ghanaian ($98,877, a difference of 0.72%), Hawaiian ($98,869, a difference of 0.73%), Immigrants from Iraq ($98,786, a difference of 0.82%), and Aleut ($98,702, a difference of 0.90%). Similarly, the demographic groups most similar to Immigrants from Ghana are Immigrants from Nigeria ($96,439, a difference of 0.11%), Sudanese ($96,783, a difference of 0.25%), Delaware ($96,958, a difference of 0.43%), Immigrants from Cambodia ($97,222, a difference of 0.70%), and Japanese ($97,288, a difference of 0.77%).
| Demographics | Rating | Rank | Median Family Income |
| Whites/Caucasians | 18.7 /100 | #202 | Poor $99,800 |
| Scotch-Irish | 17.1 /100 | #203 | Poor $99,591 |
| Ghanaians | 12.6 /100 | #204 | Poor $98,877 |
| Hawaiians | 12.5 /100 | #205 | Poor $98,869 |
| Immigrants | Iraq | 12.1 /100 | #206 | Poor $98,786 |
| Aleuts | 11.6 /100 | #207 | Poor $98,702 |
| Immigrants | Uruguay | 9.2 /100 | #208 | Tragic $98,205 |
| Immigrants | Colombia | 8.7 /100 | #209 | Tragic $98,067 |
| Puget Sound Salish | 8.2 /100 | #210 | Tragic $97,958 |
| Immigrants | Sudan | 7.4 /100 | #211 | Tragic $97,737 |
| Panamanians | 7.2 /100 | #212 | Tragic $97,683 |
| Immigrants | Armenia | 7.0 /100 | #213 | Tragic $97,605 |
| Bermudans | 6.9 /100 | #214 | Tragic $97,577 |
| Nigerians | 6.7 /100 | #215 | Tragic $97,522 |
| Immigrants | Bosnia and Herzegovina | 6.4 /100 | #216 | Tragic $97,432 |
| Japanese | 6.0 /100 | #217 | Tragic $97,288 |
| Immigrants | Cambodia | 5.8 /100 | #218 | Tragic $97,222 |
| Delaware | 5.1 /100 | #219 | Tragic $96,958 |
| Sudanese | 4.7 /100 | #220 | Tragic $96,783 |
| Immigrants | Ghana | 4.2 /100 | #221 | Tragic $96,544 |
| Immigrants | Nigeria | 4.0 /100 | #222 | Tragic $96,439 |