Hmong vs Brazilian Median Family Income
COMPARE
Hmong
Brazilian
Median Family Income
Median Family Income Comparison
Hmong
Brazilians
$91,296
MEDIAN FAMILY INCOME
0.3/ 100
METRIC RATING
265th/ 347
METRIC RANK
$106,942
MEDIAN FAMILY INCOME
89.8/ 100
METRIC RATING
130th/ 347
METRIC RANK
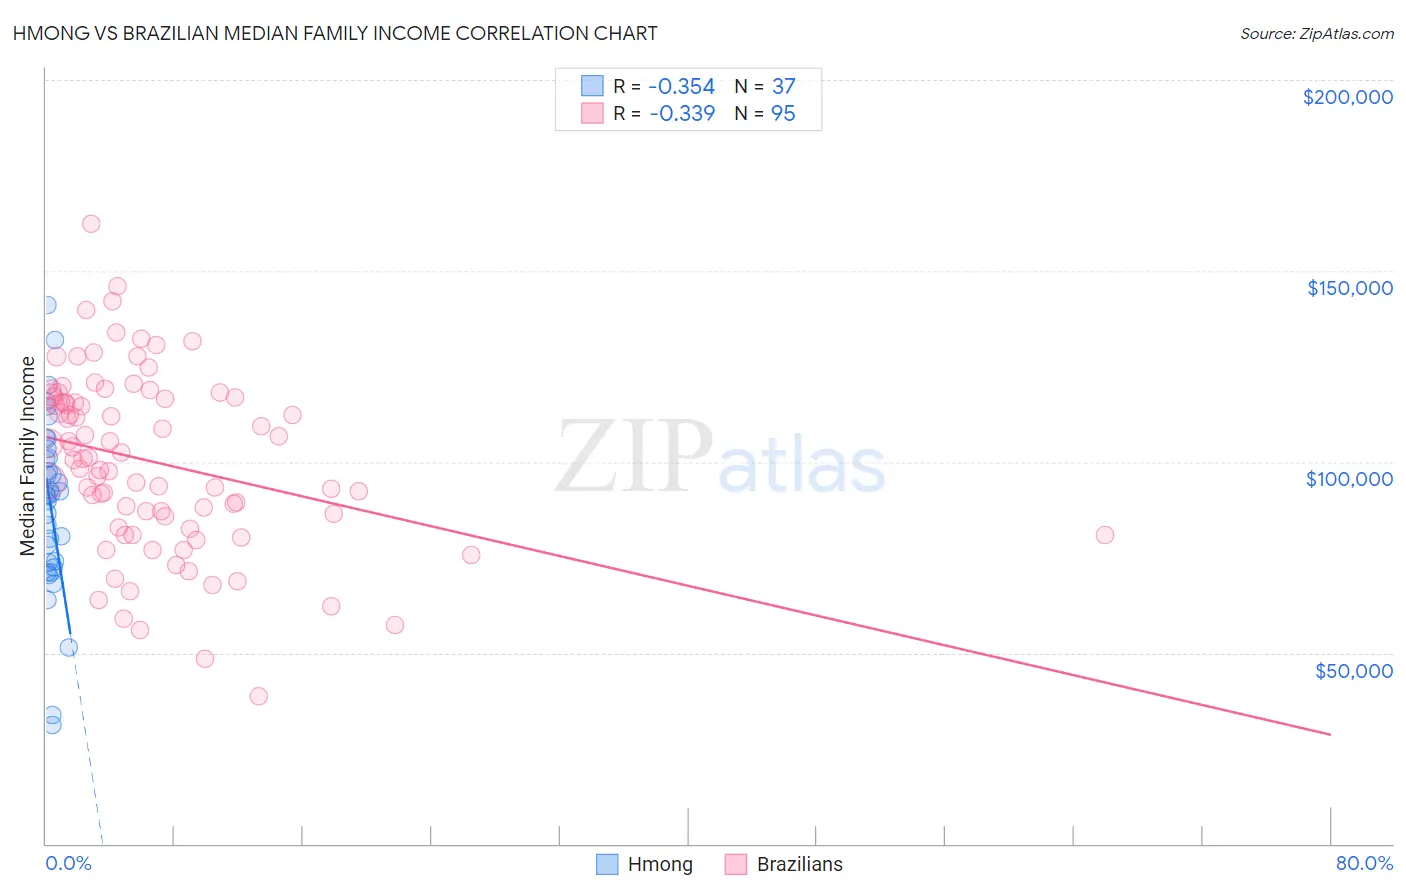
Hmong vs Brazilian Median Family Income Correlation Chart
The statistical analysis conducted on geographies consisting of 24,655,529 people shows a mild negative correlation between the proportion of Hmong and median family income in the United States with a correlation coefficient (R) of -0.354 and weighted average of $91,296. Similarly, the statistical analysis conducted on geographies consisting of 323,618,722 people shows a mild negative correlation between the proportion of Brazilians and median family income in the United States with a correlation coefficient (R) of -0.339 and weighted average of $106,942, a difference of 17.1%.
Median Family Income Correlation Summary
| Measurement | Hmong | Brazilian |
| Minimum | $31,056 | $38,641 |
| Maximum | $141,078 | $162,465 |
| Range | $110,022 | $123,824 |
| Mean | $88,552 | $99,932 |
| Median | $91,363 | $100,863 |
| Interquartile 25% (IQ1) | $73,027 | $82,900 |
| Interquartile 75% (IQ3) | $102,409 | $116,816 |
| Interquartile Range (IQR) | $29,382 | $33,916 |
| Standard Deviation (Sample) | $23,412 | $23,225 |
| Standard Deviation (Population) | $23,093 | $23,102 |
Similar Demographics by Median Family Income
Demographics Similar to Hmong by Median Family Income
In terms of median family income, the demographic groups most similar to Hmong are Senegalese ($91,475, a difference of 0.20%), Central American ($91,087, a difference of 0.23%), Immigrants from West Indies ($91,588, a difference of 0.32%), Mexican American Indian ($90,918, a difference of 0.42%), and Cree ($90,882, a difference of 0.46%).
| Demographics | Rating | Rank | Median Family Income |
| Osage | 0.4 /100 | #258 | Tragic $91,926 |
| Cape Verdeans | 0.4 /100 | #259 | Tragic $91,848 |
| Pennsylvania Germans | 0.4 /100 | #260 | Tragic $91,763 |
| Inupiat | 0.4 /100 | #261 | Tragic $91,730 |
| Liberians | 0.4 /100 | #262 | Tragic $91,722 |
| Immigrants | West Indies | 0.3 /100 | #263 | Tragic $91,588 |
| Senegalese | 0.3 /100 | #264 | Tragic $91,475 |
| Hmong | 0.3 /100 | #265 | Tragic $91,296 |
| Central Americans | 0.3 /100 | #266 | Tragic $91,087 |
| Mexican American Indians | 0.2 /100 | #267 | Tragic $90,918 |
| Cree | 0.2 /100 | #268 | Tragic $90,882 |
| Belizeans | 0.2 /100 | #269 | Tragic $90,880 |
| Jamaicans | 0.2 /100 | #270 | Tragic $90,581 |
| Iroquois | 0.2 /100 | #271 | Tragic $90,543 |
| Immigrants | Liberia | 0.2 /100 | #272 | Tragic $90,450 |
Demographics Similar to Brazilians by Median Family Income
In terms of median family income, the demographic groups most similar to Brazilians are Arab ($106,952, a difference of 0.010%), Immigrants from Ethiopia ($106,969, a difference of 0.030%), Lebanese ($107,086, a difference of 0.13%), Serbian ($107,157, a difference of 0.20%), and Canadian ($106,597, a difference of 0.32%).
| Demographics | Rating | Rank | Median Family Income |
| Carpatho Rusyns | 92.2 /100 | #123 | Exceptional $107,502 |
| Pakistanis | 91.7 /100 | #124 | Exceptional $107,390 |
| Taiwanese | 91.4 /100 | #125 | Exceptional $107,295 |
| Serbians | 90.8 /100 | #126 | Exceptional $107,157 |
| Lebanese | 90.5 /100 | #127 | Exceptional $107,086 |
| Immigrants | Ethiopia | 90.0 /100 | #128 | Excellent $106,969 |
| Arabs | 89.9 /100 | #129 | Excellent $106,952 |
| Brazilians | 89.8 /100 | #130 | Excellent $106,942 |
| Canadians | 88.1 /100 | #131 | Excellent $106,597 |
| Immigrants | Fiji | 87.8 /100 | #132 | Excellent $106,544 |
| Ugandans | 87.8 /100 | #133 | Excellent $106,541 |
| Immigrants | Oceania | 87.3 /100 | #134 | Excellent $106,453 |
| Portuguese | 86.3 /100 | #135 | Excellent $106,286 |
| Immigrants | South Eastern Asia | 86.1 /100 | #136 | Excellent $106,252 |
| Immigrants | Uganda | 85.7 /100 | #137 | Excellent $106,188 |