Scotch-Irish vs Ghanaian Median Family Income
COMPARE
Scotch-Irish
Ghanaian
Median Family Income
Median Family Income Comparison
Scotch-Irish
Ghanaians
$99,591
MEDIAN FAMILY INCOME
17.1/ 100
METRIC RATING
203rd/ 347
METRIC RANK
$98,877
MEDIAN FAMILY INCOME
12.6/ 100
METRIC RATING
204th/ 347
METRIC RANK
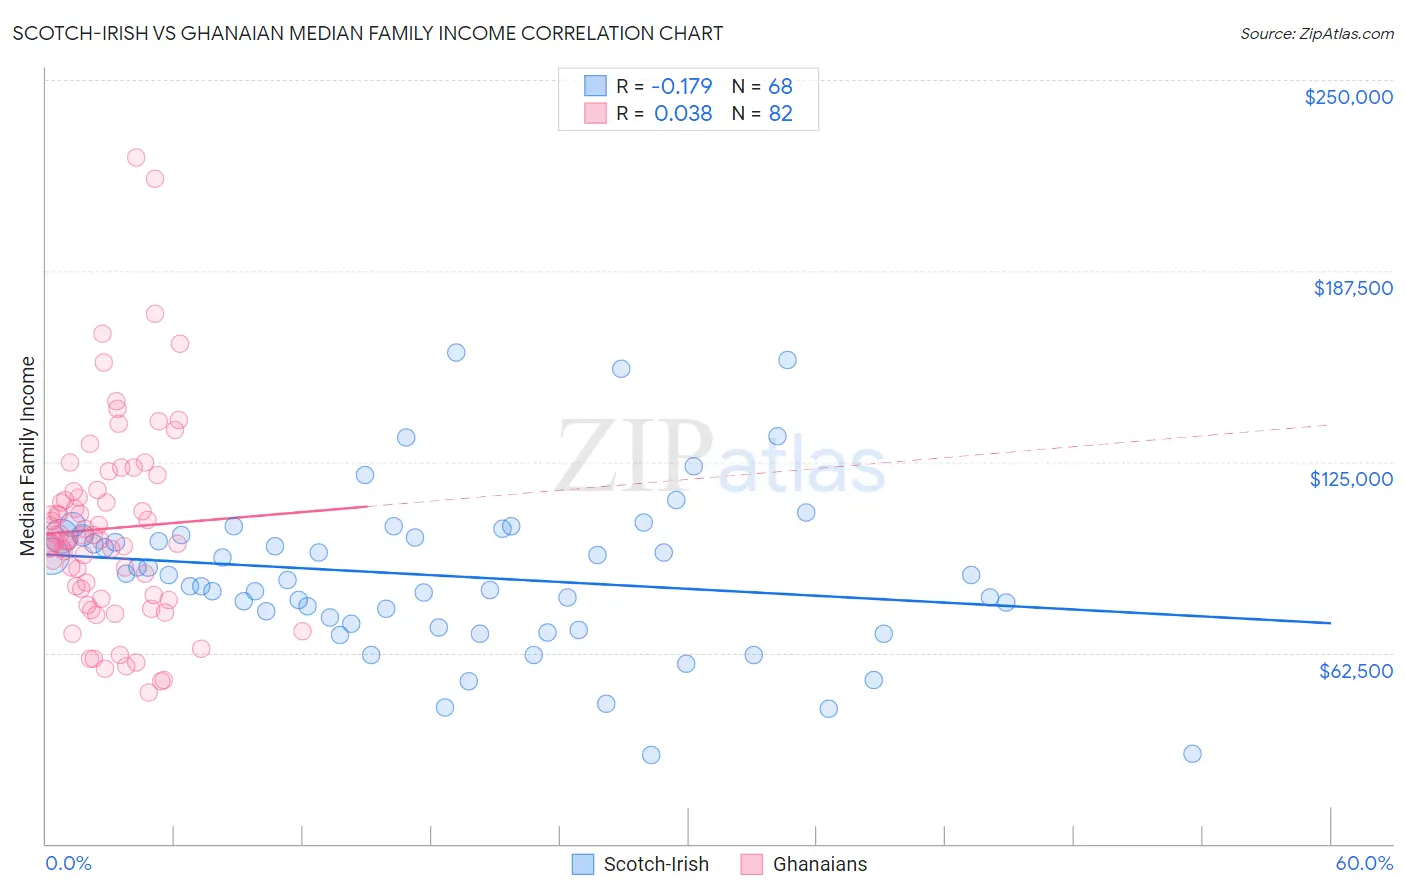
Scotch-Irish vs Ghanaian Median Family Income Correlation Chart
The statistical analysis conducted on geographies consisting of 547,821,252 people shows a poor negative correlation between the proportion of Scotch-Irish and median family income in the United States with a correlation coefficient (R) of -0.179 and weighted average of $99,591. Similarly, the statistical analysis conducted on geographies consisting of 190,476,468 people shows no correlation between the proportion of Ghanaians and median family income in the United States with a correlation coefficient (R) of 0.038 and weighted average of $98,877, a difference of 0.72%.
Median Family Income Correlation Summary
| Measurement | Scotch-Irish | Ghanaian |
| Minimum | $29,091 | $49,625 |
| Maximum | $160,619 | $224,545 |
| Range | $131,528 | $174,920 |
| Mean | $87,675 | $103,158 |
| Median | $87,122 | $99,461 |
| Interquartile 25% (IQ1) | $71,348 | $81,320 |
| Interquartile 75% (IQ3) | $100,856 | $115,481 |
| Interquartile Range (IQR) | $29,508 | $34,161 |
| Standard Deviation (Sample) | $26,299 | $32,730 |
| Standard Deviation (Population) | $26,105 | $32,529 |
Demographics Similar to Scotch-Irish and Ghanaians by Median Family Income
In terms of median family income, the demographic groups most similar to Scotch-Irish are White/Caucasian ($99,800, a difference of 0.21%), Immigrants from Thailand ($99,840, a difference of 0.25%), Spanish ($99,977, a difference of 0.39%), Yugoslavian ($100,119, a difference of 0.53%), and Immigrants from Africa ($100,256, a difference of 0.67%). Similarly, the demographic groups most similar to Ghanaians are Hawaiian ($98,869, a difference of 0.010%), Immigrants from Iraq ($98,786, a difference of 0.090%), Aleut ($98,702, a difference of 0.18%), Immigrants from Uruguay ($98,205, a difference of 0.68%), and Immigrants from Colombia ($98,067, a difference of 0.83%).
| Demographics | Rating | Rank | Median Family Income |
| Iraqis | 26.3 /100 | #193 | Fair $100,658 |
| Uruguayans | 26.3 /100 | #194 | Fair $100,656 |
| Immigrants | South America | 23.9 /100 | #195 | Fair $100,414 |
| Samoans | 23.3 /100 | #196 | Fair $100,344 |
| Immigrants | Cameroon | 22.8 /100 | #197 | Fair $100,289 |
| Immigrants | Africa | 22.5 /100 | #198 | Fair $100,256 |
| Yugoslavians | 21.3 /100 | #199 | Fair $100,119 |
| Spanish | 20.1 /100 | #200 | Fair $99,977 |
| Immigrants | Thailand | 19.0 /100 | #201 | Poor $99,840 |
| Whites/Caucasians | 18.7 /100 | #202 | Poor $99,800 |
| Scotch-Irish | 17.1 /100 | #203 | Poor $99,591 |
| Ghanaians | 12.6 /100 | #204 | Poor $98,877 |
| Hawaiians | 12.5 /100 | #205 | Poor $98,869 |
| Immigrants | Iraq | 12.1 /100 | #206 | Poor $98,786 |
| Aleuts | 11.6 /100 | #207 | Poor $98,702 |
| Immigrants | Uruguay | 9.2 /100 | #208 | Tragic $98,205 |
| Immigrants | Colombia | 8.7 /100 | #209 | Tragic $98,067 |
| Puget Sound Salish | 8.2 /100 | #210 | Tragic $97,958 |
| Immigrants | Sudan | 7.4 /100 | #211 | Tragic $97,737 |
| Panamanians | 7.2 /100 | #212 | Tragic $97,683 |
| Immigrants | Armenia | 7.0 /100 | #213 | Tragic $97,605 |