Romanian vs Iraqi Per Capita Income
COMPARE
Romanian
Iraqi
Per Capita Income
Per Capita Income Comparison
Romanians
Iraqis
$48,445
PER CAPITA INCOME
99.5/ 100
METRIC RATING
79th/ 347
METRIC RANK
$42,760
PER CAPITA INCOME
26.7/ 100
METRIC RATING
192nd/ 347
METRIC RANK
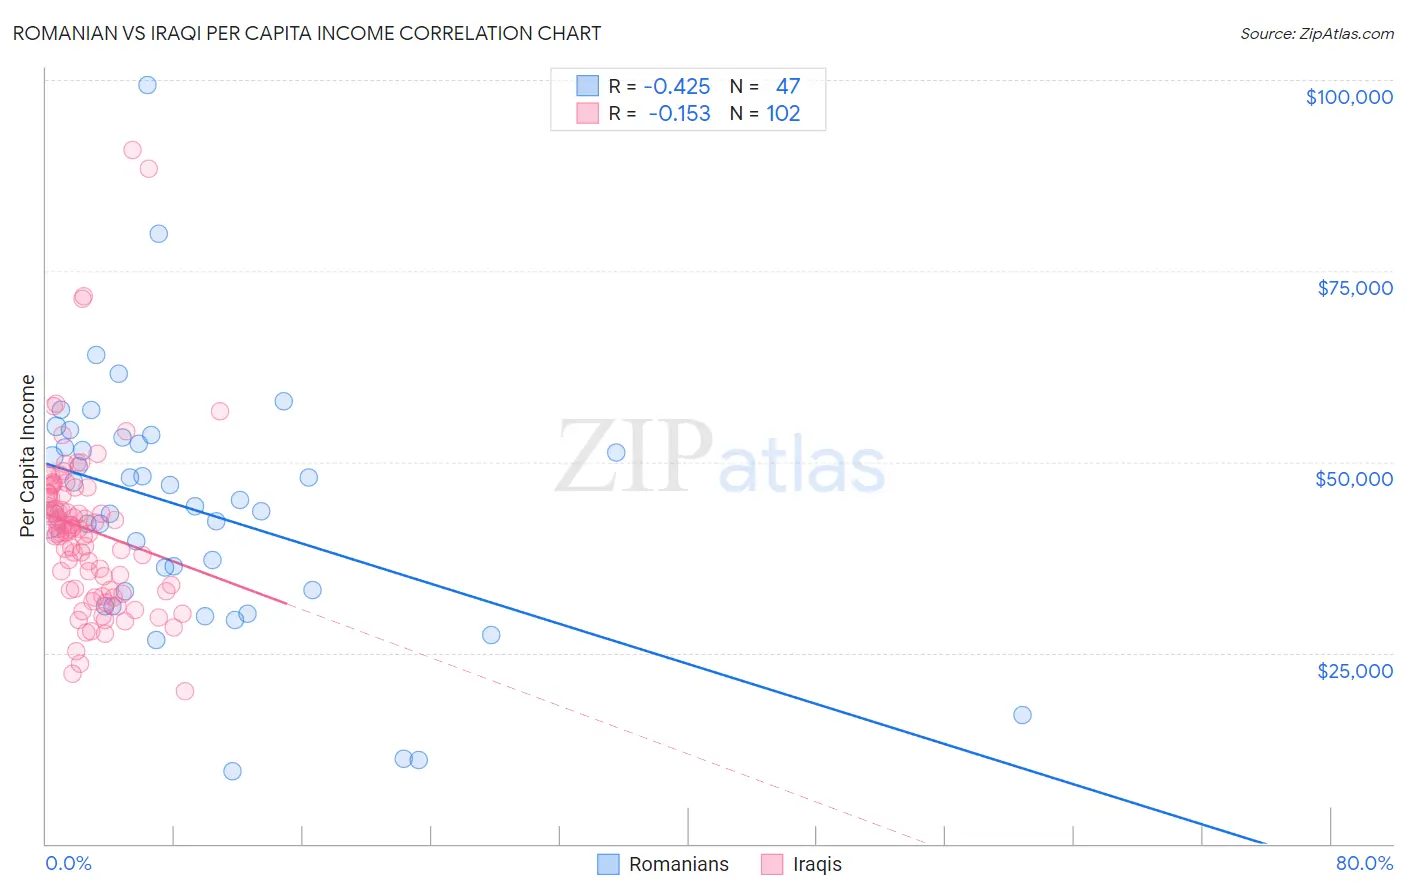
Romanian vs Iraqi Per Capita Income Correlation Chart
The statistical analysis conducted on geographies consisting of 377,926,432 people shows a moderate negative correlation between the proportion of Romanians and per capita income in the United States with a correlation coefficient (R) of -0.425 and weighted average of $48,445. Similarly, the statistical analysis conducted on geographies consisting of 170,626,957 people shows a poor negative correlation between the proportion of Iraqis and per capita income in the United States with a correlation coefficient (R) of -0.153 and weighted average of $42,760, a difference of 13.3%.
Per Capita Income Correlation Summary
| Measurement | Romanian | Iraqi |
| Minimum | $9,471 | $19,973 |
| Maximum | $99,396 | $90,903 |
| Range | $89,925 | $70,930 |
| Mean | $43,633 | $41,246 |
| Median | $44,159 | $41,205 |
| Interquartile 25% (IQ1) | $33,112 | $33,285 |
| Interquartile 75% (IQ3) | $52,383 | $45,684 |
| Interquartile Range (IQR) | $19,271 | $12,399 |
| Standard Deviation (Sample) | $16,424 | $11,272 |
| Standard Deviation (Population) | $16,248 | $11,217 |
Similar Demographics by Per Capita Income
Demographics Similar to Romanians by Per Capita Income
In terms of per capita income, the demographic groups most similar to Romanians are Egyptian ($48,358, a difference of 0.18%), Armenian ($48,287, a difference of 0.33%), Immigrants from Italy ($48,654, a difference of 0.43%), Immigrants from Indonesia ($48,195, a difference of 0.52%), and Immigrants from Brazil ($48,164, a difference of 0.58%).
| Demographics | Rating | Rank | Per Capita Income |
| Immigrants | Hungary | 99.8 /100 | #72 | Exceptional $49,303 |
| Immigrants | North America | 99.8 /100 | #73 | Exceptional $49,302 |
| Mongolians | 99.8 /100 | #74 | Exceptional $49,173 |
| Immigrants | Bolivia | 99.7 /100 | #75 | Exceptional $48,970 |
| Immigrants | England | 99.7 /100 | #76 | Exceptional $48,844 |
| Immigrants | Kazakhstan | 99.7 /100 | #77 | Exceptional $48,747 |
| Immigrants | Italy | 99.6 /100 | #78 | Exceptional $48,654 |
| Romanians | 99.5 /100 | #79 | Exceptional $48,445 |
| Egyptians | 99.5 /100 | #80 | Exceptional $48,358 |
| Armenians | 99.4 /100 | #81 | Exceptional $48,287 |
| Immigrants | Indonesia | 99.4 /100 | #82 | Exceptional $48,195 |
| Immigrants | Brazil | 99.4 /100 | #83 | Exceptional $48,164 |
| Immigrants | Ukraine | 99.3 /100 | #84 | Exceptional $48,134 |
| Austrians | 99.3 /100 | #85 | Exceptional $48,116 |
| Immigrants | Southern Europe | 99.3 /100 | #86 | Exceptional $48,027 |
Demographics Similar to Iraqis by Per Capita Income
In terms of per capita income, the demographic groups most similar to Iraqis are Immigrants from Sierra Leone ($42,752, a difference of 0.020%), Yugoslavian ($42,792, a difference of 0.070%), Kenyan ($42,808, a difference of 0.11%), Immigrants from Fiji ($42,694, a difference of 0.16%), and Immigrants from Kenya ($42,661, a difference of 0.23%).
| Demographics | Rating | Rank | Per Capita Income |
| Immigrants | Immigrants | 32.5 /100 | #185 | Fair $43,010 |
| French Canadians | 32.3 /100 | #186 | Fair $43,003 |
| Immigrants | Colombia | 31.5 /100 | #187 | Fair $42,971 |
| Immigrants | Africa | 31.0 /100 | #188 | Fair $42,950 |
| Bermudans | 30.1 /100 | #189 | Fair $42,911 |
| Kenyans | 27.7 /100 | #190 | Fair $42,808 |
| Yugoslavians | 27.4 /100 | #191 | Fair $42,792 |
| Iraqis | 26.7 /100 | #192 | Fair $42,760 |
| Immigrants | Sierra Leone | 26.5 /100 | #193 | Fair $42,752 |
| Immigrants | Fiji | 25.2 /100 | #194 | Fair $42,694 |
| Immigrants | Kenya | 24.5 /100 | #195 | Fair $42,661 |
| Dutch | 23.4 /100 | #196 | Fair $42,605 |
| Scotch-Irish | 22.6 /100 | #197 | Fair $42,563 |
| Immigrants | Portugal | 19.7 /100 | #198 | Poor $42,412 |
| Barbadians | 19.6 /100 | #199 | Poor $42,406 |