Romanian vs Puget Sound Salish Per Capita Income
COMPARE
Romanian
Puget Sound Salish
Per Capita Income
Per Capita Income Comparison
Romanians
Puget Sound Salish
$48,445
PER CAPITA INCOME
99.5/ 100
METRIC RATING
79th/ 347
METRIC RANK
$41,495
PER CAPITA INCOME
8.1/ 100
METRIC RATING
219th/ 347
METRIC RANK
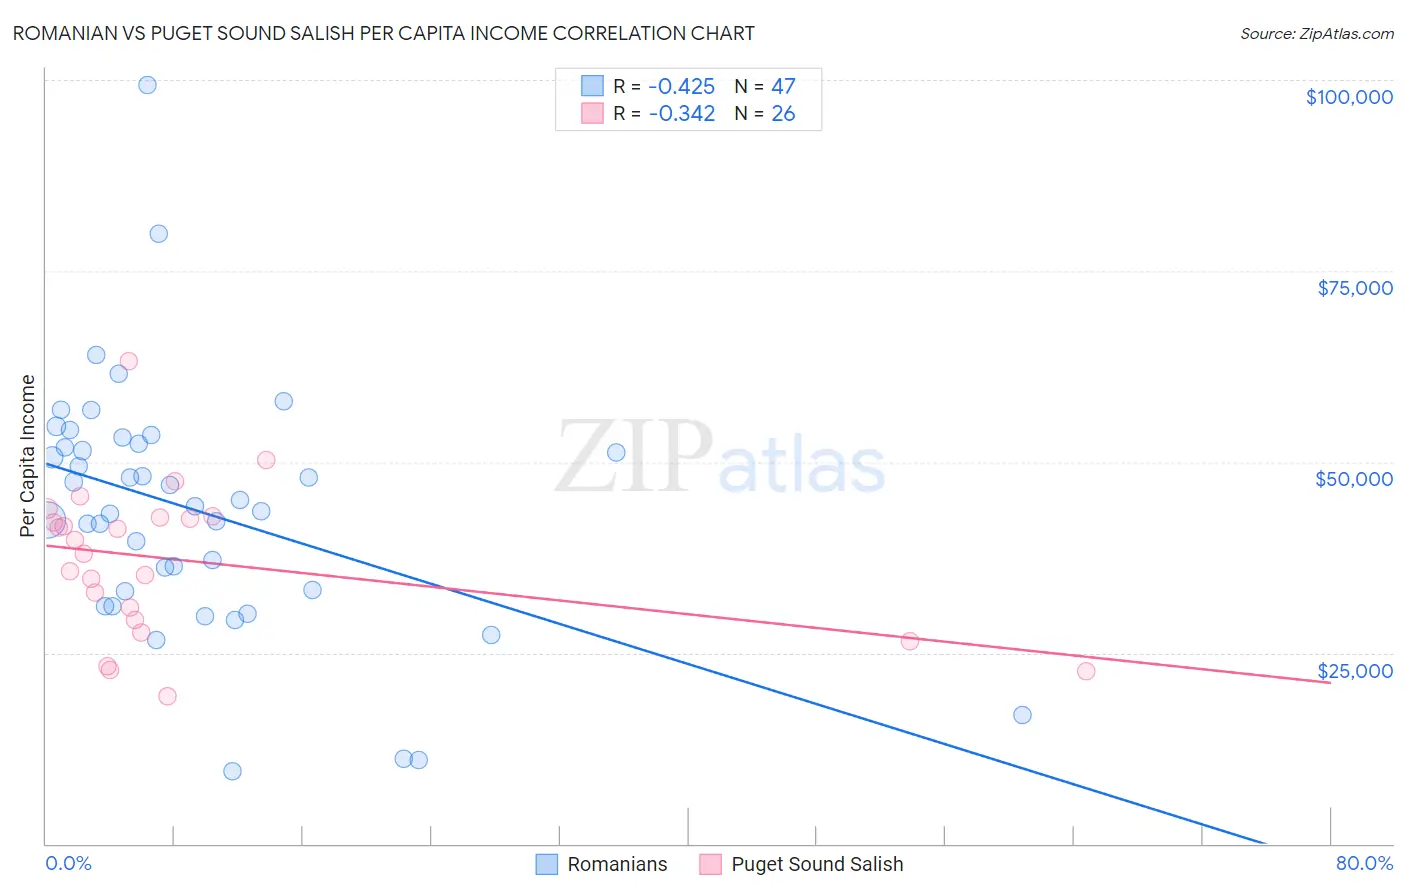
Romanian vs Puget Sound Salish Per Capita Income Correlation Chart
The statistical analysis conducted on geographies consisting of 377,926,432 people shows a moderate negative correlation between the proportion of Romanians and per capita income in the United States with a correlation coefficient (R) of -0.425 and weighted average of $48,445. Similarly, the statistical analysis conducted on geographies consisting of 46,155,865 people shows a mild negative correlation between the proportion of Puget Sound Salish and per capita income in the United States with a correlation coefficient (R) of -0.342 and weighted average of $41,495, a difference of 16.8%.
Per Capita Income Correlation Summary
| Measurement | Romanian | Puget Sound Salish |
| Minimum | $9,471 | $19,247 |
| Maximum | $99,396 | $63,213 |
| Range | $89,925 | $43,966 |
| Mean | $43,633 | $37,040 |
| Median | $44,159 | $38,913 |
| Interquartile 25% (IQ1) | $33,112 | $29,363 |
| Interquartile 75% (IQ3) | $52,383 | $42,776 |
| Interquartile Range (IQR) | $19,271 | $13,413 |
| Standard Deviation (Sample) | $16,424 | $10,042 |
| Standard Deviation (Population) | $16,248 | $9,847 |
Similar Demographics by Per Capita Income
Demographics Similar to Romanians by Per Capita Income
In terms of per capita income, the demographic groups most similar to Romanians are Egyptian ($48,358, a difference of 0.18%), Armenian ($48,287, a difference of 0.33%), Immigrants from Italy ($48,654, a difference of 0.43%), Immigrants from Indonesia ($48,195, a difference of 0.52%), and Immigrants from Brazil ($48,164, a difference of 0.58%).
| Demographics | Rating | Rank | Per Capita Income |
| Immigrants | Hungary | 99.8 /100 | #72 | Exceptional $49,303 |
| Immigrants | North America | 99.8 /100 | #73 | Exceptional $49,302 |
| Mongolians | 99.8 /100 | #74 | Exceptional $49,173 |
| Immigrants | Bolivia | 99.7 /100 | #75 | Exceptional $48,970 |
| Immigrants | England | 99.7 /100 | #76 | Exceptional $48,844 |
| Immigrants | Kazakhstan | 99.7 /100 | #77 | Exceptional $48,747 |
| Immigrants | Italy | 99.6 /100 | #78 | Exceptional $48,654 |
| Romanians | 99.5 /100 | #79 | Exceptional $48,445 |
| Egyptians | 99.5 /100 | #80 | Exceptional $48,358 |
| Armenians | 99.4 /100 | #81 | Exceptional $48,287 |
| Immigrants | Indonesia | 99.4 /100 | #82 | Exceptional $48,195 |
| Immigrants | Brazil | 99.4 /100 | #83 | Exceptional $48,164 |
| Immigrants | Ukraine | 99.3 /100 | #84 | Exceptional $48,134 |
| Austrians | 99.3 /100 | #85 | Exceptional $48,116 |
| Immigrants | Southern Europe | 99.3 /100 | #86 | Exceptional $48,027 |
Demographics Similar to Puget Sound Salish by Per Capita Income
In terms of per capita income, the demographic groups most similar to Puget Sound Salish are Immigrants from Barbados ($41,478, a difference of 0.040%), Immigrants from Trinidad and Tobago ($41,476, a difference of 0.040%), Immigrants from Iraq ($41,365, a difference of 0.31%), Trinidadian and Tobagonian ($41,655, a difference of 0.39%), and Immigrants from Cameroon ($41,334, a difference of 0.39%).
| Demographics | Rating | Rank | Per Capita Income |
| Immigrants | Senegal | 11.3 /100 | #212 | Poor $41,830 |
| Immigrants | Venezuela | 10.2 /100 | #213 | Poor $41,727 |
| Immigrants | Bangladesh | 10.1 /100 | #214 | Poor $41,709 |
| Sudanese | 9.9 /100 | #215 | Tragic $41,695 |
| Tongans | 9.9 /100 | #216 | Tragic $41,693 |
| Guamanians/Chamorros | 9.7 /100 | #217 | Tragic $41,678 |
| Trinidadians and Tobagonians | 9.5 /100 | #218 | Tragic $41,655 |
| Puget Sound Salish | 8.1 /100 | #219 | Tragic $41,495 |
| Immigrants | Barbados | 7.9 /100 | #220 | Tragic $41,478 |
| Immigrants | Trinidad and Tobago | 7.9 /100 | #221 | Tragic $41,476 |
| Immigrants | Iraq | 7.1 /100 | #222 | Tragic $41,365 |
| Immigrants | Cameroon | 6.8 /100 | #223 | Tragic $41,334 |
| Immigrants | St. Vincent and the Grenadines | 6.4 /100 | #224 | Tragic $41,270 |
| West Indians | 6.0 /100 | #225 | Tragic $41,217 |
| Immigrants | Ecuador | 5.9 /100 | #226 | Tragic $41,195 |