Romanian vs Asian Per Capita Income
COMPARE
Romanian
Asian
Per Capita Income
Per Capita Income Comparison
Romanians
Asians
$48,445
PER CAPITA INCOME
99.5/ 100
METRIC RATING
79th/ 347
METRIC RANK
$50,057
PER CAPITA INCOME
99.9/ 100
METRIC RATING
56th/ 347
METRIC RANK
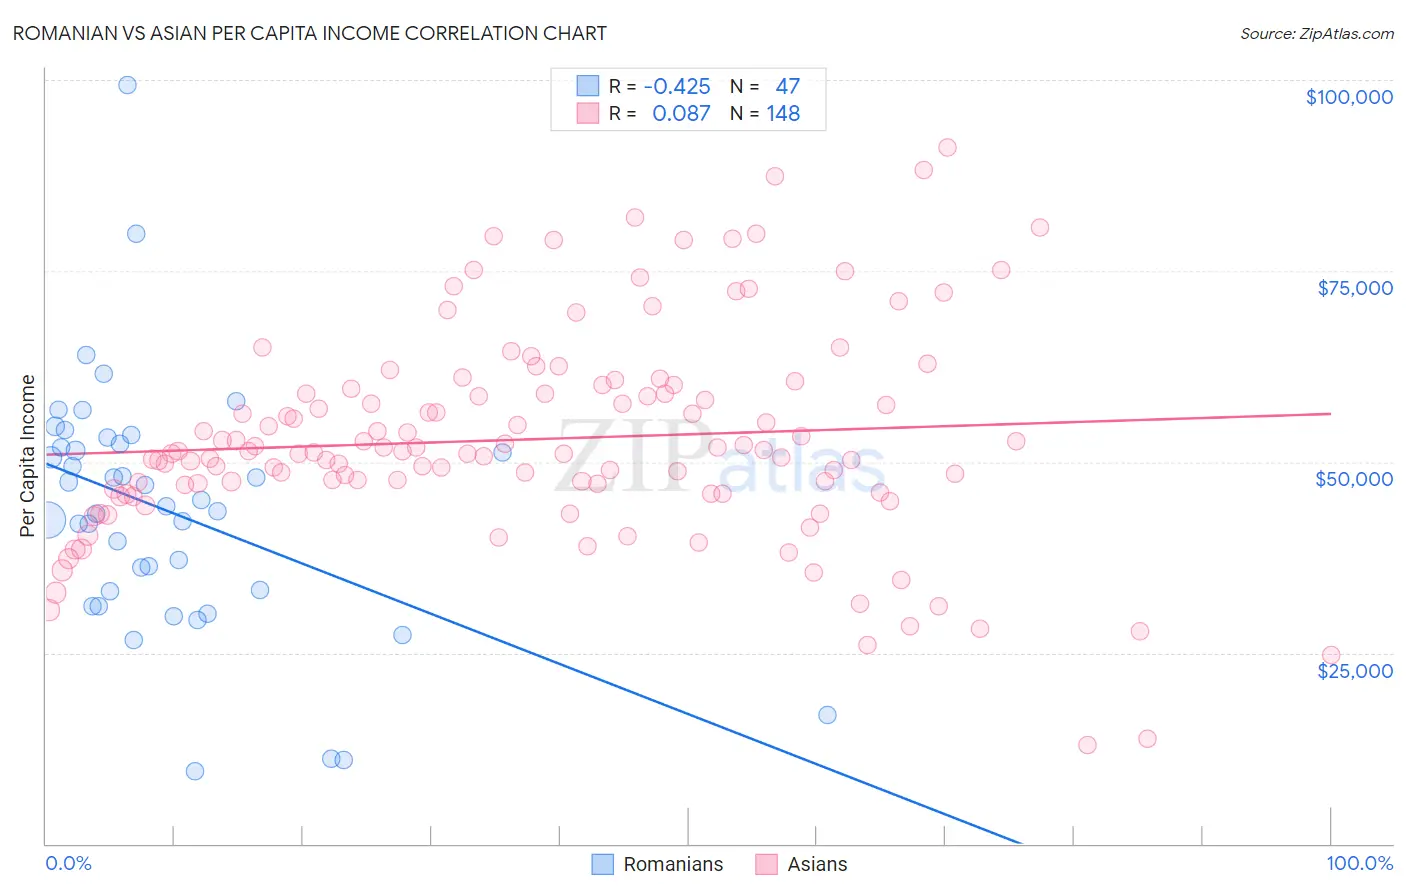
Romanian vs Asian Per Capita Income Correlation Chart
The statistical analysis conducted on geographies consisting of 377,926,432 people shows a moderate negative correlation between the proportion of Romanians and per capita income in the United States with a correlation coefficient (R) of -0.425 and weighted average of $48,445. Similarly, the statistical analysis conducted on geographies consisting of 550,984,990 people shows a slight positive correlation between the proportion of Asians and per capita income in the United States with a correlation coefficient (R) of 0.087 and weighted average of $50,057, a difference of 3.3%.
Per Capita Income Correlation Summary
| Measurement | Romanian | Asian |
| Minimum | $9,471 | $12,941 |
| Maximum | $99,396 | $91,125 |
| Range | $89,925 | $78,184 |
| Mean | $43,633 | $52,955 |
| Median | $44,159 | $51,252 |
| Interquartile 25% (IQ1) | $33,112 | $46,204 |
| Interquartile 75% (IQ3) | $52,383 | $59,246 |
| Interquartile Range (IQR) | $19,271 | $13,041 |
| Standard Deviation (Sample) | $16,424 | $13,804 |
| Standard Deviation (Population) | $16,248 | $13,757 |
Similar Demographics by Per Capita Income
Demographics Similar to Romanians by Per Capita Income
In terms of per capita income, the demographic groups most similar to Romanians are Egyptian ($48,358, a difference of 0.18%), Armenian ($48,287, a difference of 0.33%), Immigrants from Italy ($48,654, a difference of 0.43%), Immigrants from Indonesia ($48,195, a difference of 0.52%), and Immigrants from Brazil ($48,164, a difference of 0.58%).
| Demographics | Rating | Rank | Per Capita Income |
| Immigrants | Hungary | 99.8 /100 | #72 | Exceptional $49,303 |
| Immigrants | North America | 99.8 /100 | #73 | Exceptional $49,302 |
| Mongolians | 99.8 /100 | #74 | Exceptional $49,173 |
| Immigrants | Bolivia | 99.7 /100 | #75 | Exceptional $48,970 |
| Immigrants | England | 99.7 /100 | #76 | Exceptional $48,844 |
| Immigrants | Kazakhstan | 99.7 /100 | #77 | Exceptional $48,747 |
| Immigrants | Italy | 99.6 /100 | #78 | Exceptional $48,654 |
| Romanians | 99.5 /100 | #79 | Exceptional $48,445 |
| Egyptians | 99.5 /100 | #80 | Exceptional $48,358 |
| Armenians | 99.4 /100 | #81 | Exceptional $48,287 |
| Immigrants | Indonesia | 99.4 /100 | #82 | Exceptional $48,195 |
| Immigrants | Brazil | 99.4 /100 | #83 | Exceptional $48,164 |
| Immigrants | Ukraine | 99.3 /100 | #84 | Exceptional $48,134 |
| Austrians | 99.3 /100 | #85 | Exceptional $48,116 |
| Immigrants | Southern Europe | 99.3 /100 | #86 | Exceptional $48,027 |
Demographics Similar to Asians by Per Capita Income
In terms of per capita income, the demographic groups most similar to Asians are Immigrants from Western Europe ($50,065, a difference of 0.020%), South African ($50,044, a difference of 0.030%), Immigrants from Malaysia ($49,983, a difference of 0.15%), Bhutanese ($49,894, a difference of 0.33%), and Immigrants from Scotland ($49,893, a difference of 0.33%).
| Demographics | Rating | Rank | Per Capita Income |
| New Zealanders | 100.0 /100 | #49 | Exceptional $50,575 |
| Immigrants | Sri Lanka | 100.0 /100 | #50 | Exceptional $50,555 |
| Immigrants | Netherlands | 100.0 /100 | #51 | Exceptional $50,458 |
| Immigrants | Croatia | 99.9 /100 | #52 | Exceptional $50,417 |
| Paraguayans | 99.9 /100 | #53 | Exceptional $50,385 |
| Immigrants | Belarus | 99.9 /100 | #54 | Exceptional $50,303 |
| Immigrants | Western Europe | 99.9 /100 | #55 | Exceptional $50,065 |
| Asians | 99.9 /100 | #56 | Exceptional $50,057 |
| South Africans | 99.9 /100 | #57 | Exceptional $50,044 |
| Immigrants | Malaysia | 99.9 /100 | #58 | Exceptional $49,983 |
| Bhutanese | 99.9 /100 | #59 | Exceptional $49,894 |
| Immigrants | Scotland | 99.9 /100 | #60 | Exceptional $49,893 |
| Argentineans | 99.9 /100 | #61 | Exceptional $49,862 |
| Immigrants | Asia | 99.9 /100 | #62 | Exceptional $49,741 |
| Maltese | 99.9 /100 | #63 | Exceptional $49,640 |