Romanian vs Hawaiian Per Capita Income
COMPARE
Romanian
Hawaiian
Per Capita Income
Per Capita Income Comparison
Romanians
Hawaiians
$48,445
PER CAPITA INCOME
99.5/ 100
METRIC RATING
79th/ 347
METRIC RANK
$39,403
PER CAPITA INCOME
0.8/ 100
METRIC RATING
256th/ 347
METRIC RANK
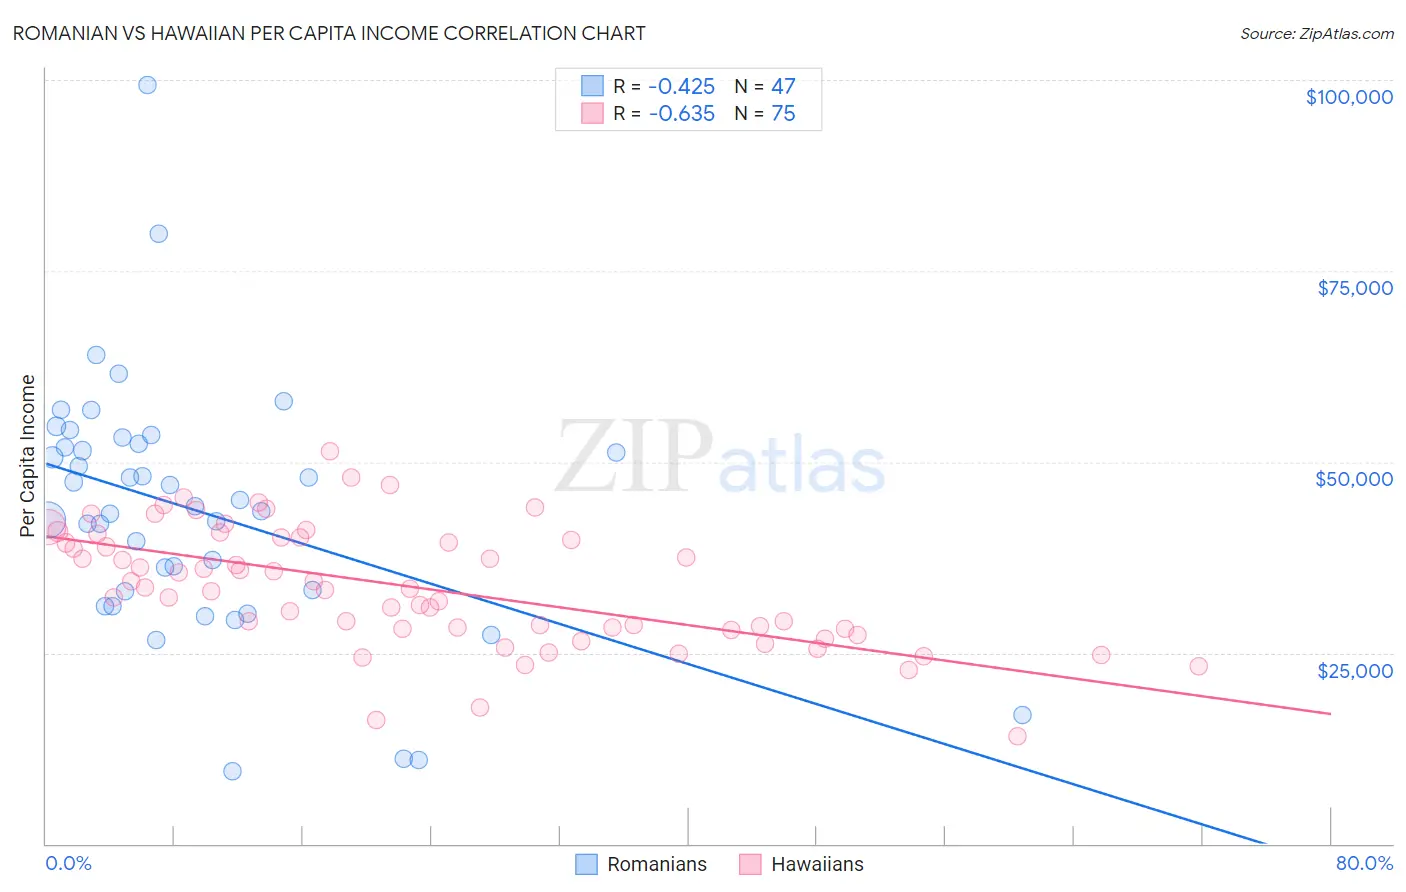
Romanian vs Hawaiian Per Capita Income Correlation Chart
The statistical analysis conducted on geographies consisting of 377,926,432 people shows a moderate negative correlation between the proportion of Romanians and per capita income in the United States with a correlation coefficient (R) of -0.425 and weighted average of $48,445. Similarly, the statistical analysis conducted on geographies consisting of 327,629,067 people shows a significant negative correlation between the proportion of Hawaiians and per capita income in the United States with a correlation coefficient (R) of -0.635 and weighted average of $39,403, a difference of 23.0%.
Per Capita Income Correlation Summary
| Measurement | Romanian | Hawaiian |
| Minimum | $9,471 | $14,082 |
| Maximum | $99,396 | $51,335 |
| Range | $89,925 | $37,253 |
| Mean | $43,633 | $33,620 |
| Median | $44,159 | $33,340 |
| Interquartile 25% (IQ1) | $33,112 | $28,161 |
| Interquartile 75% (IQ3) | $52,383 | $40,110 |
| Interquartile Range (IQR) | $19,271 | $11,949 |
| Standard Deviation (Sample) | $16,424 | $7,838 |
| Standard Deviation (Population) | $16,248 | $7,785 |
Similar Demographics by Per Capita Income
Demographics Similar to Romanians by Per Capita Income
In terms of per capita income, the demographic groups most similar to Romanians are Egyptian ($48,358, a difference of 0.18%), Armenian ($48,287, a difference of 0.33%), Immigrants from Italy ($48,654, a difference of 0.43%), Immigrants from Indonesia ($48,195, a difference of 0.52%), and Immigrants from Brazil ($48,164, a difference of 0.58%).
| Demographics | Rating | Rank | Per Capita Income |
| Immigrants | Hungary | 99.8 /100 | #72 | Exceptional $49,303 |
| Immigrants | North America | 99.8 /100 | #73 | Exceptional $49,302 |
| Mongolians | 99.8 /100 | #74 | Exceptional $49,173 |
| Immigrants | Bolivia | 99.7 /100 | #75 | Exceptional $48,970 |
| Immigrants | England | 99.7 /100 | #76 | Exceptional $48,844 |
| Immigrants | Kazakhstan | 99.7 /100 | #77 | Exceptional $48,747 |
| Immigrants | Italy | 99.6 /100 | #78 | Exceptional $48,654 |
| Romanians | 99.5 /100 | #79 | Exceptional $48,445 |
| Egyptians | 99.5 /100 | #80 | Exceptional $48,358 |
| Armenians | 99.4 /100 | #81 | Exceptional $48,287 |
| Immigrants | Indonesia | 99.4 /100 | #82 | Exceptional $48,195 |
| Immigrants | Brazil | 99.4 /100 | #83 | Exceptional $48,164 |
| Immigrants | Ukraine | 99.3 /100 | #84 | Exceptional $48,134 |
| Austrians | 99.3 /100 | #85 | Exceptional $48,116 |
| Immigrants | Southern Europe | 99.3 /100 | #86 | Exceptional $48,027 |
Demographics Similar to Hawaiians by Per Capita Income
In terms of per capita income, the demographic groups most similar to Hawaiians are Nicaraguan ($39,372, a difference of 0.080%), Immigrants from Middle Africa ($39,529, a difference of 0.32%), Alaska Native ($39,558, a difference of 0.39%), Osage ($39,568, a difference of 0.42%), and Jamaican ($39,231, a difference of 0.44%).
| Demographics | Rating | Rank | Per Capita Income |
| Japanese | 1.4 /100 | #249 | Tragic $39,870 |
| Immigrants | Burma/Myanmar | 1.3 /100 | #250 | Tragic $39,827 |
| Samoans | 1.3 /100 | #251 | Tragic $39,826 |
| Immigrants | Azores | 1.0 /100 | #252 | Tragic $39,608 |
| Osage | 1.0 /100 | #253 | Tragic $39,568 |
| Alaska Natives | 1.0 /100 | #254 | Tragic $39,558 |
| Immigrants | Middle Africa | 1.0 /100 | #255 | Tragic $39,529 |
| Hawaiians | 0.8 /100 | #256 | Tragic $39,403 |
| Nicaraguans | 0.8 /100 | #257 | Tragic $39,372 |
| Jamaicans | 0.7 /100 | #258 | Tragic $39,231 |
| Malaysians | 0.7 /100 | #259 | Tragic $39,194 |
| Alaskan Athabascans | 0.6 /100 | #260 | Tragic $39,163 |
| Marshallese | 0.6 /100 | #261 | Tragic $39,108 |
| Iroquois | 0.6 /100 | #262 | Tragic $39,104 |
| Belizeans | 0.6 /100 | #263 | Tragic $39,097 |