Romanian vs Mexican American Indian Per Capita Income
COMPARE
Romanian
Mexican American Indian
Per Capita Income
Per Capita Income Comparison
Romanians
Mexican American Indians
$48,445
PER CAPITA INCOME
99.5/ 100
METRIC RATING
79th/ 347
METRIC RANK
$37,407
PER CAPITA INCOME
0.1/ 100
METRIC RATING
293rd/ 347
METRIC RANK
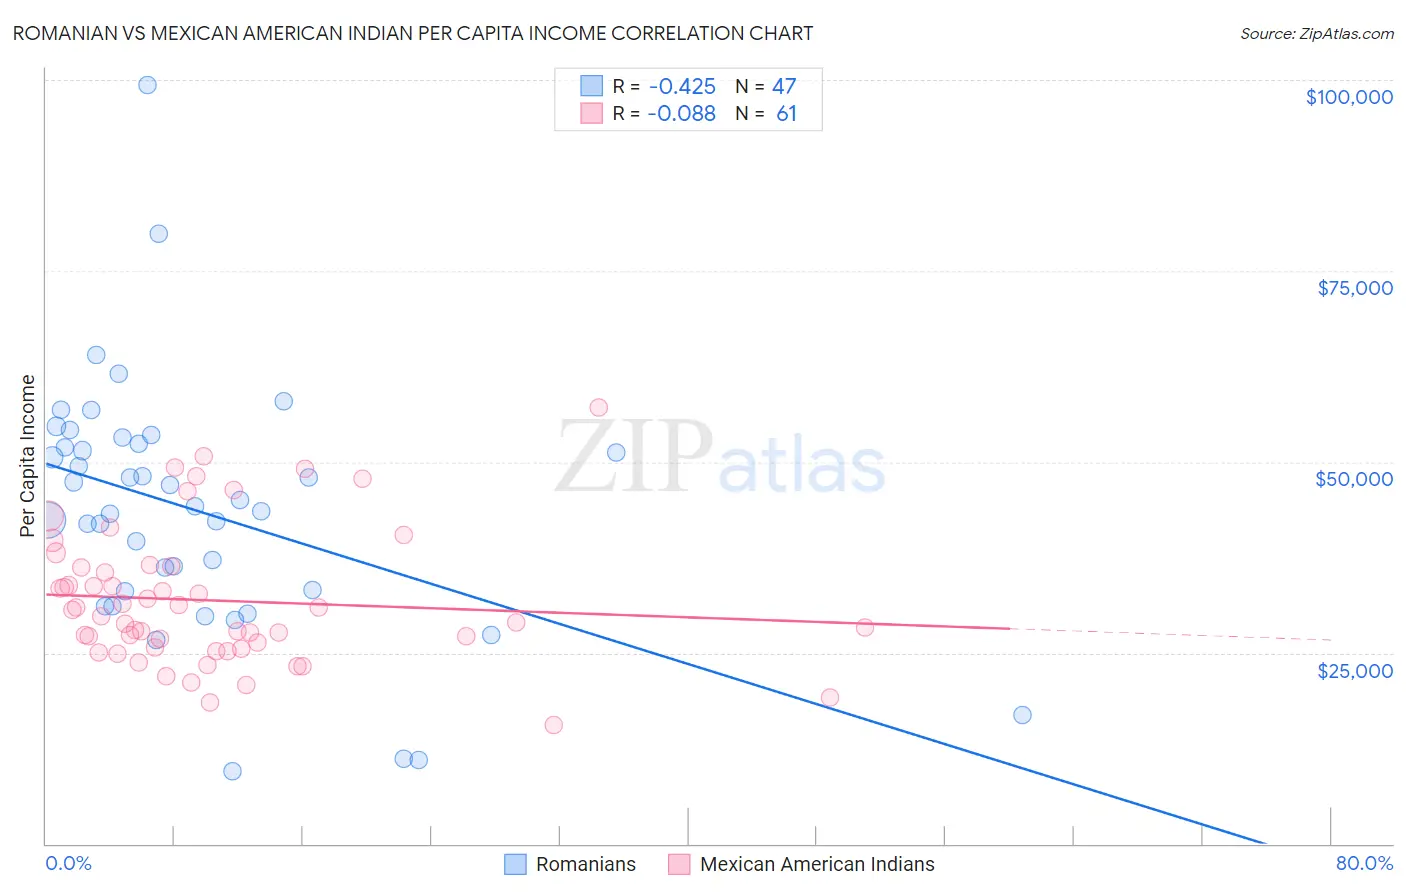
Romanian vs Mexican American Indian Per Capita Income Correlation Chart
The statistical analysis conducted on geographies consisting of 377,926,432 people shows a moderate negative correlation between the proportion of Romanians and per capita income in the United States with a correlation coefficient (R) of -0.425 and weighted average of $48,445. Similarly, the statistical analysis conducted on geographies consisting of 317,620,021 people shows a slight negative correlation between the proportion of Mexican American Indians and per capita income in the United States with a correlation coefficient (R) of -0.088 and weighted average of $37,407, a difference of 29.5%.
Per Capita Income Correlation Summary
| Measurement | Romanian | Mexican American Indian |
| Minimum | $9,471 | $15,543 |
| Maximum | $99,396 | $57,099 |
| Range | $89,925 | $41,556 |
| Mean | $43,633 | $31,846 |
| Median | $44,159 | $29,756 |
| Interquartile 25% (IQ1) | $33,112 | $25,545 |
| Interquartile 75% (IQ3) | $52,383 | $36,256 |
| Interquartile Range (IQR) | $19,271 | $10,711 |
| Standard Deviation (Sample) | $16,424 | $8,902 |
| Standard Deviation (Population) | $16,248 | $8,828 |
Similar Demographics by Per Capita Income
Demographics Similar to Romanians by Per Capita Income
In terms of per capita income, the demographic groups most similar to Romanians are Egyptian ($48,358, a difference of 0.18%), Armenian ($48,287, a difference of 0.33%), Immigrants from Italy ($48,654, a difference of 0.43%), Immigrants from Indonesia ($48,195, a difference of 0.52%), and Immigrants from Brazil ($48,164, a difference of 0.58%).
| Demographics | Rating | Rank | Per Capita Income |
| Immigrants | Hungary | 99.8 /100 | #72 | Exceptional $49,303 |
| Immigrants | North America | 99.8 /100 | #73 | Exceptional $49,302 |
| Mongolians | 99.8 /100 | #74 | Exceptional $49,173 |
| Immigrants | Bolivia | 99.7 /100 | #75 | Exceptional $48,970 |
| Immigrants | England | 99.7 /100 | #76 | Exceptional $48,844 |
| Immigrants | Kazakhstan | 99.7 /100 | #77 | Exceptional $48,747 |
| Immigrants | Italy | 99.6 /100 | #78 | Exceptional $48,654 |
| Romanians | 99.5 /100 | #79 | Exceptional $48,445 |
| Egyptians | 99.5 /100 | #80 | Exceptional $48,358 |
| Armenians | 99.4 /100 | #81 | Exceptional $48,287 |
| Immigrants | Indonesia | 99.4 /100 | #82 | Exceptional $48,195 |
| Immigrants | Brazil | 99.4 /100 | #83 | Exceptional $48,164 |
| Immigrants | Ukraine | 99.3 /100 | #84 | Exceptional $48,134 |
| Austrians | 99.3 /100 | #85 | Exceptional $48,116 |
| Immigrants | Southern Europe | 99.3 /100 | #86 | Exceptional $48,027 |
Demographics Similar to Mexican American Indians by Per Capita Income
In terms of per capita income, the demographic groups most similar to Mexican American Indians are Cuban ($37,383, a difference of 0.070%), Immigrants from Micronesia ($37,464, a difference of 0.15%), Immigrants from Dominican Republic ($37,306, a difference of 0.27%), Indonesian ($37,300, a difference of 0.29%), and Cajun ($37,527, a difference of 0.32%).
| Demographics | Rating | Rank | Per Capita Income |
| Central American Indians | 0.1 /100 | #286 | Tragic $37,699 |
| Dominicans | 0.1 /100 | #287 | Tragic $37,697 |
| Blackfeet | 0.1 /100 | #288 | Tragic $37,695 |
| U.S. Virgin Islanders | 0.1 /100 | #289 | Tragic $37,589 |
| Immigrants | Guatemala | 0.1 /100 | #290 | Tragic $37,550 |
| Cajuns | 0.1 /100 | #291 | Tragic $37,527 |
| Immigrants | Micronesia | 0.1 /100 | #292 | Tragic $37,464 |
| Mexican American Indians | 0.1 /100 | #293 | Tragic $37,407 |
| Cubans | 0.1 /100 | #294 | Tragic $37,383 |
| Immigrants | Dominican Republic | 0.1 /100 | #295 | Tragic $37,306 |
| Indonesians | 0.1 /100 | #296 | Tragic $37,300 |
| Haitians | 0.1 /100 | #297 | Tragic $37,289 |
| Immigrants | Caribbean | 0.1 /100 | #298 | Tragic $37,254 |
| Cherokee | 0.1 /100 | #299 | Tragic $37,203 |
| Immigrants | Bahamas | 0.1 /100 | #300 | Tragic $37,193 |