Portuguese vs Alaska Native Per Capita Income
COMPARE
Portuguese
Alaska Native
Per Capita Income
Per Capita Income Comparison
Portuguese
Alaska Natives
$44,362
PER CAPITA INCOME
68.7/ 100
METRIC RATING
154th/ 347
METRIC RANK
$39,558
PER CAPITA INCOME
1.0/ 100
METRIC RATING
254th/ 347
METRIC RANK
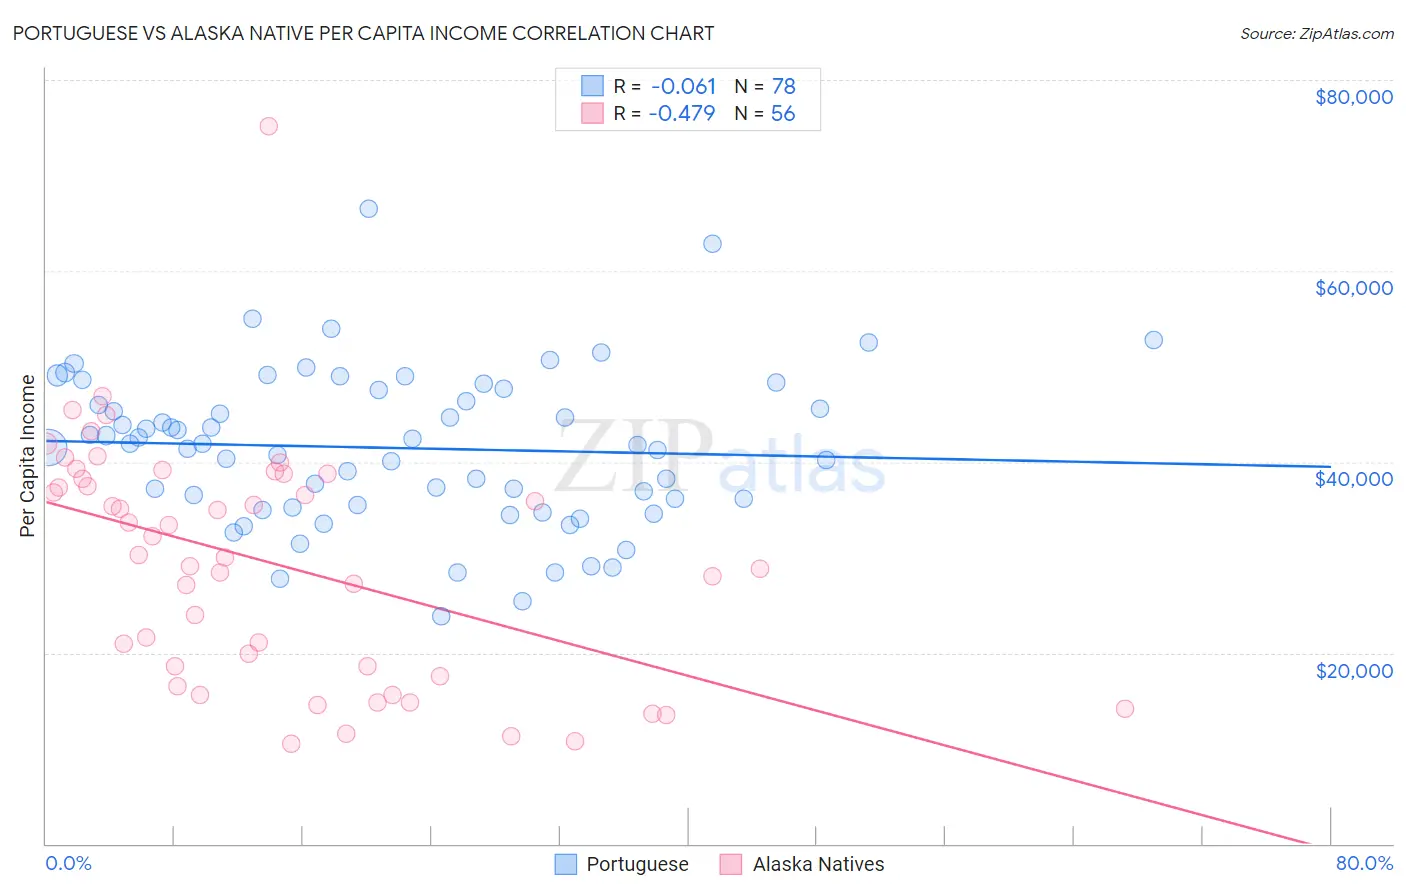
Portuguese vs Alaska Native Per Capita Income Correlation Chart
The statistical analysis conducted on geographies consisting of 450,379,372 people shows a slight negative correlation between the proportion of Portuguese and per capita income in the United States with a correlation coefficient (R) of -0.061 and weighted average of $44,362. Similarly, the statistical analysis conducted on geographies consisting of 76,776,237 people shows a moderate negative correlation between the proportion of Alaska Natives and per capita income in the United States with a correlation coefficient (R) of -0.479 and weighted average of $39,558, a difference of 12.1%.
Per Capita Income Correlation Summary
| Measurement | Portuguese | Alaska Native |
| Minimum | $23,853 | $10,456 |
| Maximum | $66,467 | $75,144 |
| Range | $42,614 | $64,688 |
| Mean | $41,456 | $29,356 |
| Median | $41,782 | $30,080 |
| Interquartile 25% (IQ1) | $35,480 | $18,080 |
| Interquartile 75% (IQ3) | $47,466 | $38,478 |
| Interquartile Range (IQR) | $11,986 | $20,399 |
| Standard Deviation (Sample) | $8,108 | $12,502 |
| Standard Deviation (Population) | $8,056 | $12,390 |
Similar Demographics by Per Capita Income
Demographics Similar to Portuguese by Per Capita Income
In terms of per capita income, the demographic groups most similar to Portuguese are Uruguayan ($44,318, a difference of 0.10%), Scottish ($44,440, a difference of 0.18%), Peruvian ($44,479, a difference of 0.26%), Norwegian ($44,480, a difference of 0.27%), and Slovak ($44,229, a difference of 0.30%).
| Demographics | Rating | Rank | Per Capita Income |
| Czechs | 74.1 /100 | #147 | Good $44,595 |
| Immigrants | Armenia | 73.1 /100 | #148 | Good $44,552 |
| Koreans | 72.5 /100 | #149 | Good $44,522 |
| Immigrants | Eritrea | 72.1 /100 | #150 | Good $44,509 |
| Norwegians | 71.5 /100 | #151 | Good $44,480 |
| Peruvians | 71.5 /100 | #152 | Good $44,479 |
| Scottish | 70.6 /100 | #153 | Good $44,440 |
| Portuguese | 68.7 /100 | #154 | Good $44,362 |
| Uruguayans | 67.6 /100 | #155 | Good $44,318 |
| Slovaks | 65.4 /100 | #156 | Good $44,229 |
| South American Indians | 64.8 /100 | #157 | Good $44,206 |
| Immigrants | Nepal | 64.3 /100 | #158 | Good $44,187 |
| South Americans | 62.4 /100 | #159 | Good $44,114 |
| Danes | 61.9 /100 | #160 | Good $44,095 |
| Costa Ricans | 61.8 /100 | #161 | Good $44,090 |
Demographics Similar to Alaska Natives by Per Capita Income
In terms of per capita income, the demographic groups most similar to Alaska Natives are Osage ($39,568, a difference of 0.020%), Immigrants from Middle Africa ($39,529, a difference of 0.070%), Immigrants from the Azores ($39,608, a difference of 0.13%), Hawaiian ($39,403, a difference of 0.39%), and Nicaraguan ($39,372, a difference of 0.47%).
| Demographics | Rating | Rank | Per Capita Income |
| Immigrants | Somalia | 1.6 /100 | #247 | Tragic $39,974 |
| Cape Verdeans | 1.5 /100 | #248 | Tragic $39,935 |
| Japanese | 1.4 /100 | #249 | Tragic $39,870 |
| Immigrants | Burma/Myanmar | 1.3 /100 | #250 | Tragic $39,827 |
| Samoans | 1.3 /100 | #251 | Tragic $39,826 |
| Immigrants | Azores | 1.0 /100 | #252 | Tragic $39,608 |
| Osage | 1.0 /100 | #253 | Tragic $39,568 |
| Alaska Natives | 1.0 /100 | #254 | Tragic $39,558 |
| Immigrants | Middle Africa | 1.0 /100 | #255 | Tragic $39,529 |
| Hawaiians | 0.8 /100 | #256 | Tragic $39,403 |
| Nicaraguans | 0.8 /100 | #257 | Tragic $39,372 |
| Jamaicans | 0.7 /100 | #258 | Tragic $39,231 |
| Malaysians | 0.7 /100 | #259 | Tragic $39,194 |
| Alaskan Athabascans | 0.6 /100 | #260 | Tragic $39,163 |
| Marshallese | 0.6 /100 | #261 | Tragic $39,108 |