Portuguese vs Apache College, 1 year or more
COMPARE
Portuguese
Apache
College, 1 year or more
College, 1 year or more Comparison
Portuguese
Apache
57.2%
COLLEGE, 1 YEAR OR MORE
5.4/ 100
METRIC RATING
223rd/ 347
METRIC RANK
51.8%
COLLEGE, 1 YEAR OR MORE
0.0/ 100
METRIC RATING
309th/ 347
METRIC RANK
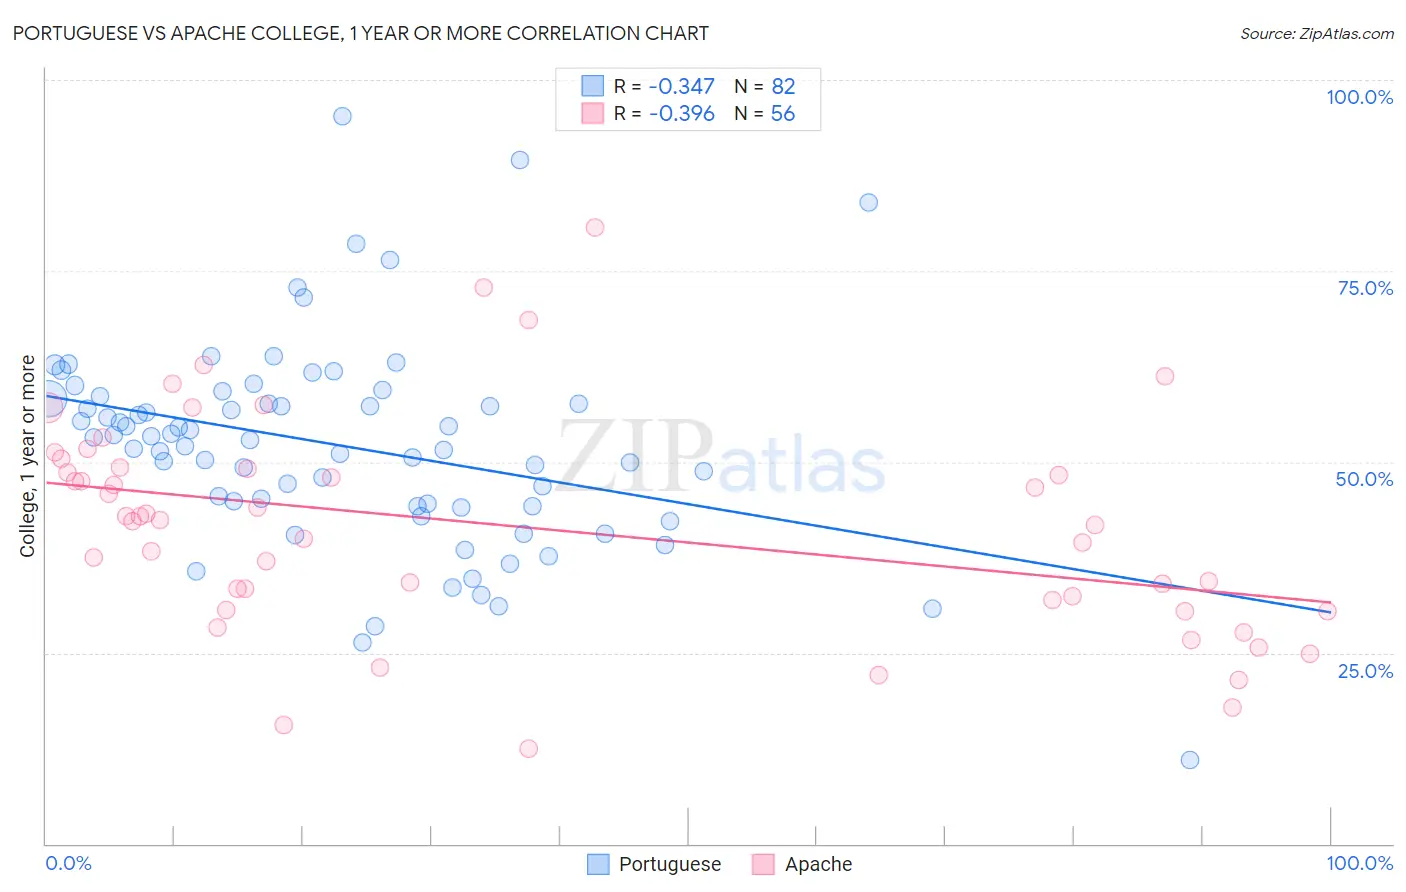
Portuguese vs Apache College, 1 year or more Correlation Chart
The statistical analysis conducted on geographies consisting of 450,364,670 people shows a mild negative correlation between the proportion of Portuguese and percentage of population with at least college, 1 year or more education in the United States with a correlation coefficient (R) of -0.347 and weighted average of 57.2%. Similarly, the statistical analysis conducted on geographies consisting of 231,142,948 people shows a mild negative correlation between the proportion of Apache and percentage of population with at least college, 1 year or more education in the United States with a correlation coefficient (R) of -0.396 and weighted average of 51.8%, a difference of 10.3%.
College, 1 year or more Correlation Summary
| Measurement | Portuguese | Apache |
| Minimum | 11.0% | 12.5% |
| Maximum | 95.3% | 80.6% |
| Range | 84.4% | 68.1% |
| Mean | 52.1% | 41.5% |
| Median | 53.0% | 42.4% |
| Interquartile 25% (IQ1) | 44.2% | 31.2% |
| Interquartile 75% (IQ3) | 58.2% | 49.2% |
| Interquartile Range (IQR) | 14.0% | 18.0% |
| Standard Deviation (Sample) | 13.6% | 14.3% |
| Standard Deviation (Population) | 13.5% | 14.1% |
Similar Demographics by College, 1 year or more
Demographics Similar to Portuguese by College, 1 year or more
In terms of college, 1 year or more, the demographic groups most similar to Portuguese are Hmong (57.2%, a difference of 0.0%), Subsaharan African (57.3%, a difference of 0.17%), Vietnamese (57.0%, a difference of 0.21%), Immigrants from Western Africa (57.0%, a difference of 0.23%), and Immigrants (57.0%, a difference of 0.30%).
| Demographics | Rating | Rank | College, 1 year or more |
| Immigrants | Peru | 10.6 /100 | #216 | Poor 57.7% |
| Immigrants | Panama | 9.1 /100 | #217 | Tragic 57.6% |
| Native Hawaiians | 9.0 /100 | #218 | Tragic 57.6% |
| Whites/Caucasians | 8.7 /100 | #219 | Tragic 57.6% |
| Immigrants | Costa Rica | 8.0 /100 | #220 | Tragic 57.5% |
| Immigrants | Ghana | 7.7 /100 | #221 | Tragic 57.4% |
| Sub-Saharan Africans | 6.1 /100 | #222 | Tragic 57.3% |
| Portuguese | 5.4 /100 | #223 | Tragic 57.2% |
| Hmong | 5.4 /100 | #224 | Tragic 57.2% |
| Vietnamese | 4.7 /100 | #225 | Tragic 57.0% |
| Immigrants | Western Africa | 4.6 /100 | #226 | Tragic 57.0% |
| Immigrants | Immigrants | 4.4 /100 | #227 | Tragic 57.0% |
| Immigrants | Fiji | 4.0 /100 | #228 | Tragic 56.9% |
| Cree | 3.6 /100 | #229 | Tragic 56.8% |
| Liberians | 3.1 /100 | #230 | Tragic 56.7% |
Demographics Similar to Apache by College, 1 year or more
In terms of college, 1 year or more, the demographic groups most similar to Apache are Salvadoran (51.8%, a difference of 0.010%), Immigrants from Portugal (51.9%, a difference of 0.11%), Mexican American Indian (51.9%, a difference of 0.22%), Honduran (51.6%, a difference of 0.39%), and Seminole (52.1%, a difference of 0.55%).
| Demographics | Rating | Rank | College, 1 year or more |
| Puerto Ricans | 0.0 /100 | #302 | Tragic 52.2% |
| Creek | 0.0 /100 | #303 | Tragic 52.2% |
| Central Americans | 0.0 /100 | #304 | Tragic 52.1% |
| Seminole | 0.0 /100 | #305 | Tragic 52.1% |
| Mexican American Indians | 0.0 /100 | #306 | Tragic 51.9% |
| Immigrants | Portugal | 0.0 /100 | #307 | Tragic 51.9% |
| Salvadorans | 0.0 /100 | #308 | Tragic 51.8% |
| Apache | 0.0 /100 | #309 | Tragic 51.8% |
| Hondurans | 0.0 /100 | #310 | Tragic 51.6% |
| Immigrants | Haiti | 0.0 /100 | #311 | Tragic 51.5% |
| Pueblo | 0.0 /100 | #312 | Tragic 51.5% |
| Immigrants | Caribbean | 0.0 /100 | #313 | Tragic 51.4% |
| Fijians | 0.0 /100 | #314 | Tragic 51.3% |
| Guatemalans | 0.0 /100 | #315 | Tragic 51.2% |
| Cajuns | 0.0 /100 | #316 | Tragic 51.2% |