Portuguese vs Immigrants from Afghanistan Per Capita Income
COMPARE
Portuguese
Immigrants from Afghanistan
Per Capita Income
Per Capita Income Comparison
Portuguese
Immigrants from Afghanistan
$44,362
PER CAPITA INCOME
68.7/ 100
METRIC RATING
154th/ 347
METRIC RANK
$44,790
PER CAPITA INCOME
78.0/ 100
METRIC RATING
145th/ 347
METRIC RANK
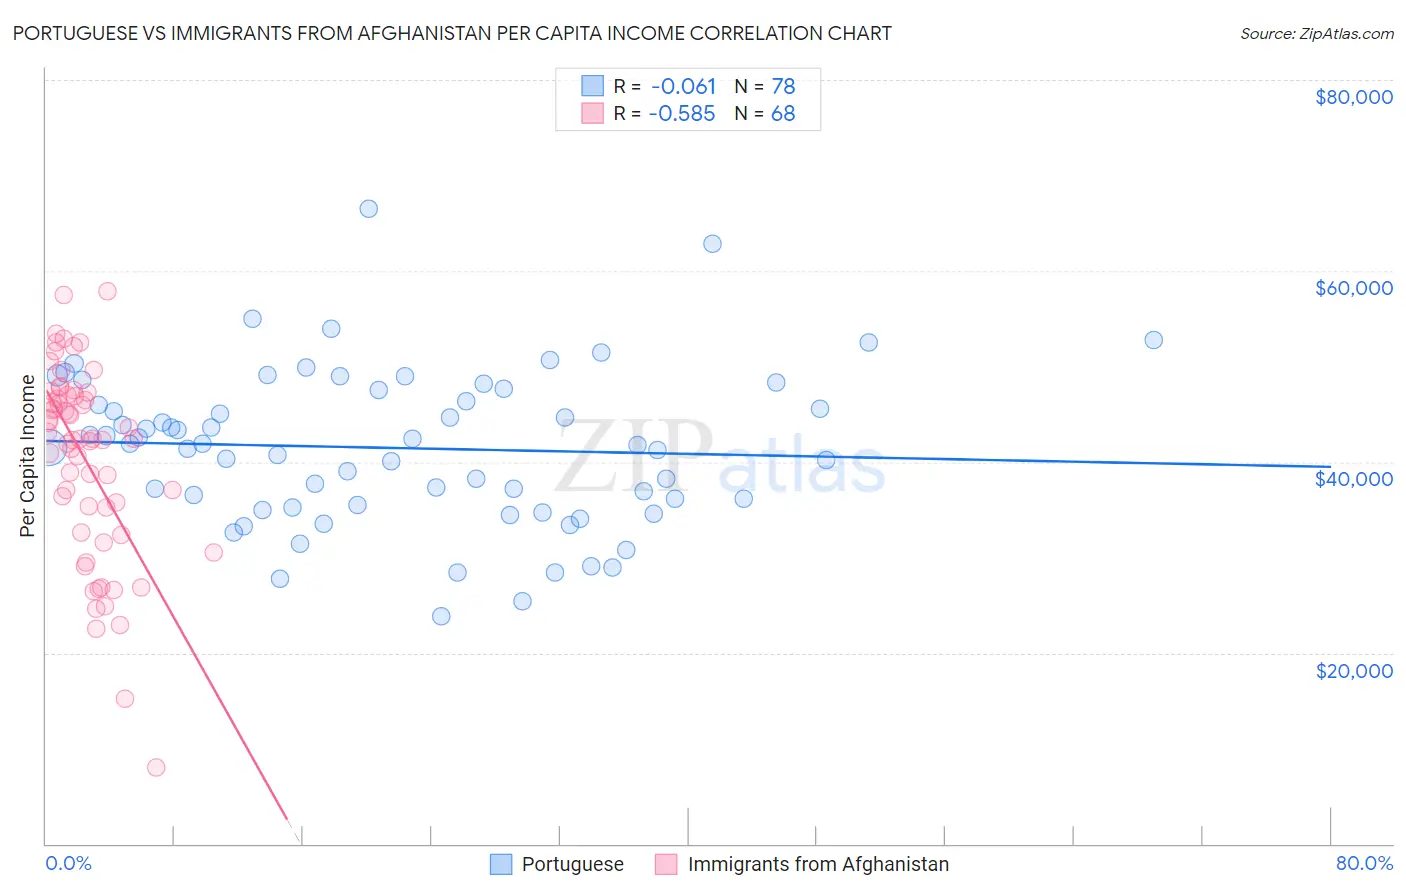
Portuguese vs Immigrants from Afghanistan Per Capita Income Correlation Chart
The statistical analysis conducted on geographies consisting of 450,379,372 people shows a slight negative correlation between the proportion of Portuguese and per capita income in the United States with a correlation coefficient (R) of -0.061 and weighted average of $44,362. Similarly, the statistical analysis conducted on geographies consisting of 147,645,791 people shows a substantial negative correlation between the proportion of Immigrants from Afghanistan and per capita income in the United States with a correlation coefficient (R) of -0.585 and weighted average of $44,790, a difference of 0.96%.
Per Capita Income Correlation Summary
| Measurement | Portuguese | Immigrants from Afghanistan |
| Minimum | $23,853 | $8,026 |
| Maximum | $66,467 | $57,850 |
| Range | $42,614 | $49,824 |
| Mean | $41,456 | $40,206 |
| Median | $41,782 | $42,427 |
| Interquartile 25% (IQ1) | $35,480 | $33,957 |
| Interquartile 75% (IQ3) | $47,466 | $46,949 |
| Interquartile Range (IQR) | $11,986 | $12,992 |
| Standard Deviation (Sample) | $8,108 | $10,126 |
| Standard Deviation (Population) | $8,056 | $10,052 |
Demographics Similar to Portuguese and Immigrants from Afghanistan by Per Capita Income
In terms of per capita income, the demographic groups most similar to Portuguese are Uruguayan ($44,318, a difference of 0.10%), Scottish ($44,440, a difference of 0.18%), Peruvian ($44,479, a difference of 0.26%), Norwegian ($44,480, a difference of 0.27%), and Slovak ($44,229, a difference of 0.30%). Similarly, the demographic groups most similar to Immigrants from Afghanistan are Irish ($44,679, a difference of 0.25%), Icelander ($44,987, a difference of 0.44%), Czech ($44,595, a difference of 0.44%), Immigrants from Armenia ($44,552, a difference of 0.53%), and Immigrants from Uganda ($45,043, a difference of 0.56%).
| Demographics | Rating | Rank | Per Capita Income |
| Basques | 83.2 /100 | #139 | Excellent $45,086 |
| Immigrants | Jordan | 82.9 /100 | #140 | Excellent $45,066 |
| Slavs | 82.6 /100 | #141 | Excellent $45,049 |
| Ugandans | 82.6 /100 | #142 | Excellent $45,047 |
| Immigrants | Uganda | 82.5 /100 | #143 | Excellent $45,043 |
| Icelanders | 81.6 /100 | #144 | Excellent $44,987 |
| Immigrants | Afghanistan | 78.0 /100 | #145 | Good $44,790 |
| Irish | 75.8 /100 | #146 | Good $44,679 |
| Czechs | 74.1 /100 | #147 | Good $44,595 |
| Immigrants | Armenia | 73.1 /100 | #148 | Good $44,552 |
| Koreans | 72.5 /100 | #149 | Good $44,522 |
| Immigrants | Eritrea | 72.1 /100 | #150 | Good $44,509 |
| Norwegians | 71.5 /100 | #151 | Good $44,480 |
| Peruvians | 71.5 /100 | #152 | Good $44,479 |
| Scottish | 70.6 /100 | #153 | Good $44,440 |
| Portuguese | 68.7 /100 | #154 | Good $44,362 |
| Uruguayans | 67.6 /100 | #155 | Good $44,318 |
| Slovaks | 65.4 /100 | #156 | Good $44,229 |
| South American Indians | 64.8 /100 | #157 | Good $44,206 |
| Immigrants | Nepal | 64.3 /100 | #158 | Good $44,187 |
| South Americans | 62.4 /100 | #159 | Good $44,114 |