Portuguese vs Immigrants from Northern Africa Per Capita Income
COMPARE
Portuguese
Immigrants from Northern Africa
Per Capita Income
Per Capita Income Comparison
Portuguese
Immigrants from Northern Africa
$44,362
PER CAPITA INCOME
68.7/ 100
METRIC RATING
154th/ 347
METRIC RANK
$46,531
PER CAPITA INCOME
96.2/ 100
METRIC RATING
109th/ 347
METRIC RANK
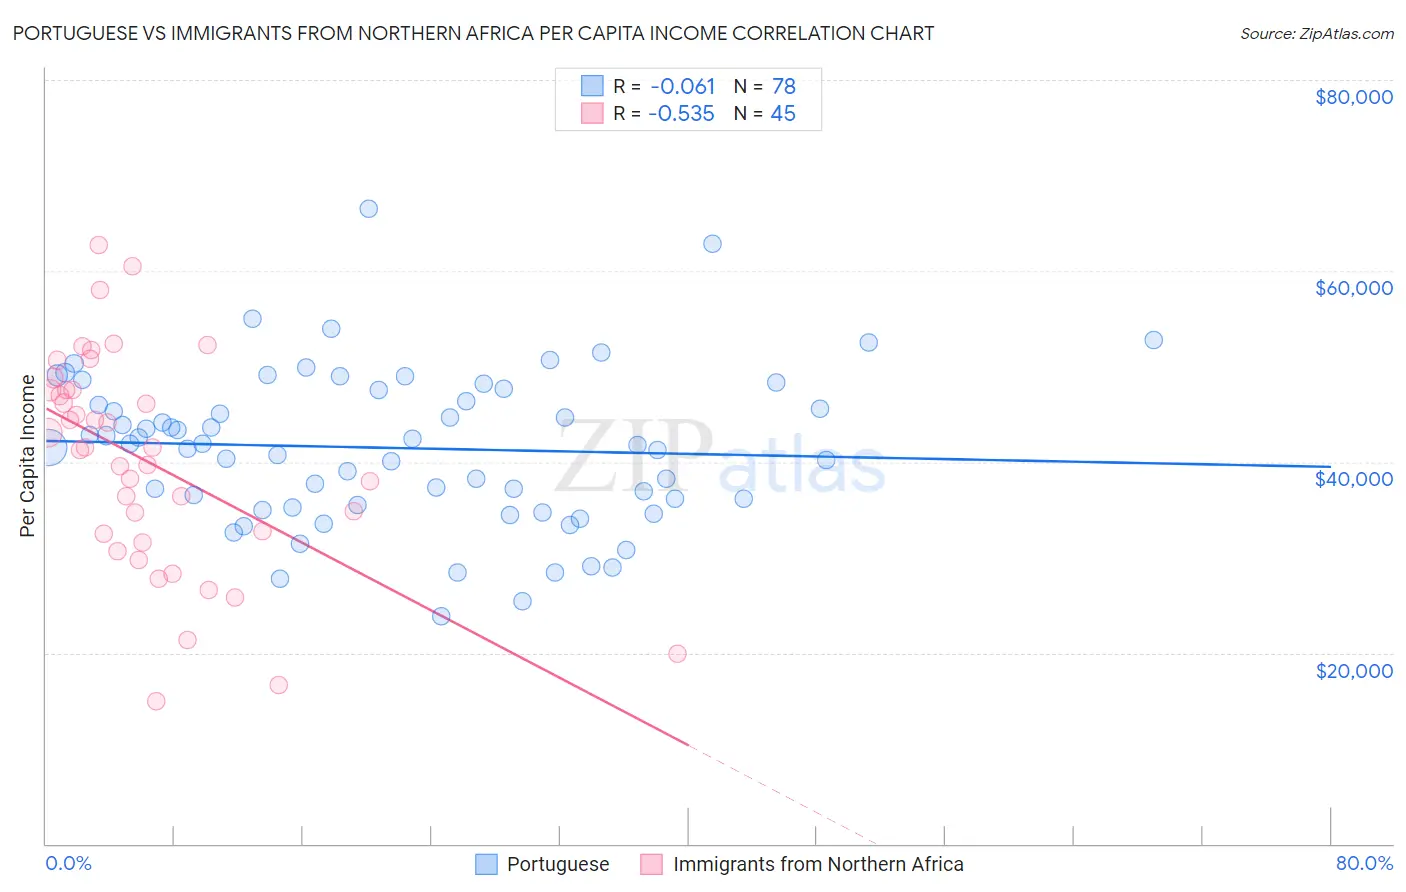
Portuguese vs Immigrants from Northern Africa Per Capita Income Correlation Chart
The statistical analysis conducted on geographies consisting of 450,379,372 people shows a slight negative correlation between the proportion of Portuguese and per capita income in the United States with a correlation coefficient (R) of -0.061 and weighted average of $44,362. Similarly, the statistical analysis conducted on geographies consisting of 321,207,992 people shows a substantial negative correlation between the proportion of Immigrants from Northern Africa and per capita income in the United States with a correlation coefficient (R) of -0.535 and weighted average of $46,531, a difference of 4.9%.
Per Capita Income Correlation Summary
| Measurement | Portuguese | Immigrants from Northern Africa |
| Minimum | $23,853 | $14,939 |
| Maximum | $66,467 | $62,708 |
| Range | $42,614 | $47,769 |
| Mean | $41,456 | $40,067 |
| Median | $41,782 | $41,480 |
| Interquartile 25% (IQ1) | $35,480 | $32,060 |
| Interquartile 75% (IQ3) | $47,466 | $47,546 |
| Interquartile Range (IQR) | $11,986 | $15,486 |
| Standard Deviation (Sample) | $8,108 | $11,278 |
| Standard Deviation (Population) | $8,056 | $11,152 |
Similar Demographics by Per Capita Income
Demographics Similar to Portuguese by Per Capita Income
In terms of per capita income, the demographic groups most similar to Portuguese are Uruguayan ($44,318, a difference of 0.10%), Scottish ($44,440, a difference of 0.18%), Peruvian ($44,479, a difference of 0.26%), Norwegian ($44,480, a difference of 0.27%), and Slovak ($44,229, a difference of 0.30%).
| Demographics | Rating | Rank | Per Capita Income |
| Czechs | 74.1 /100 | #147 | Good $44,595 |
| Immigrants | Armenia | 73.1 /100 | #148 | Good $44,552 |
| Koreans | 72.5 /100 | #149 | Good $44,522 |
| Immigrants | Eritrea | 72.1 /100 | #150 | Good $44,509 |
| Norwegians | 71.5 /100 | #151 | Good $44,480 |
| Peruvians | 71.5 /100 | #152 | Good $44,479 |
| Scottish | 70.6 /100 | #153 | Good $44,440 |
| Portuguese | 68.7 /100 | #154 | Good $44,362 |
| Uruguayans | 67.6 /100 | #155 | Good $44,318 |
| Slovaks | 65.4 /100 | #156 | Good $44,229 |
| South American Indians | 64.8 /100 | #157 | Good $44,206 |
| Immigrants | Nepal | 64.3 /100 | #158 | Good $44,187 |
| South Americans | 62.4 /100 | #159 | Good $44,114 |
| Danes | 61.9 /100 | #160 | Good $44,095 |
| Costa Ricans | 61.8 /100 | #161 | Good $44,090 |
Demographics Similar to Immigrants from Northern Africa by Per Capita Income
In terms of per capita income, the demographic groups most similar to Immigrants from Northern Africa are Immigrants from Kuwait ($46,543, a difference of 0.030%), Serbian ($46,551, a difference of 0.040%), Ethiopian ($46,569, a difference of 0.080%), British ($46,571, a difference of 0.090%), and Chilean ($46,459, a difference of 0.15%).
| Demographics | Rating | Rank | Per Capita Income |
| Immigrants | Western Asia | 97.4 /100 | #102 | Exceptional $46,876 |
| Syrians | 97.2 /100 | #103 | Exceptional $46,837 |
| Brazilians | 96.8 /100 | #104 | Exceptional $46,700 |
| British | 96.3 /100 | #105 | Exceptional $46,571 |
| Ethiopians | 96.3 /100 | #106 | Exceptional $46,569 |
| Serbians | 96.2 /100 | #107 | Exceptional $46,551 |
| Immigrants | Kuwait | 96.2 /100 | #108 | Exceptional $46,543 |
| Immigrants | Northern Africa | 96.2 /100 | #109 | Exceptional $46,531 |
| Chileans | 95.9 /100 | #110 | Exceptional $46,459 |
| Taiwanese | 95.8 /100 | #111 | Exceptional $46,455 |
| Immigrants | Morocco | 95.7 /100 | #112 | Exceptional $46,430 |
| Immigrants | Albania | 95.5 /100 | #113 | Exceptional $46,387 |
| Afghans | 94.9 /100 | #114 | Exceptional $46,268 |
| Immigrants | Chile | 94.6 /100 | #115 | Exceptional $46,213 |
| Poles | 94.1 /100 | #116 | Exceptional $46,123 |