Portuguese vs New Zealander Per Capita Income
COMPARE
Portuguese
New Zealander
Per Capita Income
Per Capita Income Comparison
Portuguese
New Zealanders
$44,362
PER CAPITA INCOME
68.7/ 100
METRIC RATING
154th/ 347
METRIC RANK
$50,575
PER CAPITA INCOME
100.0/ 100
METRIC RATING
49th/ 347
METRIC RANK
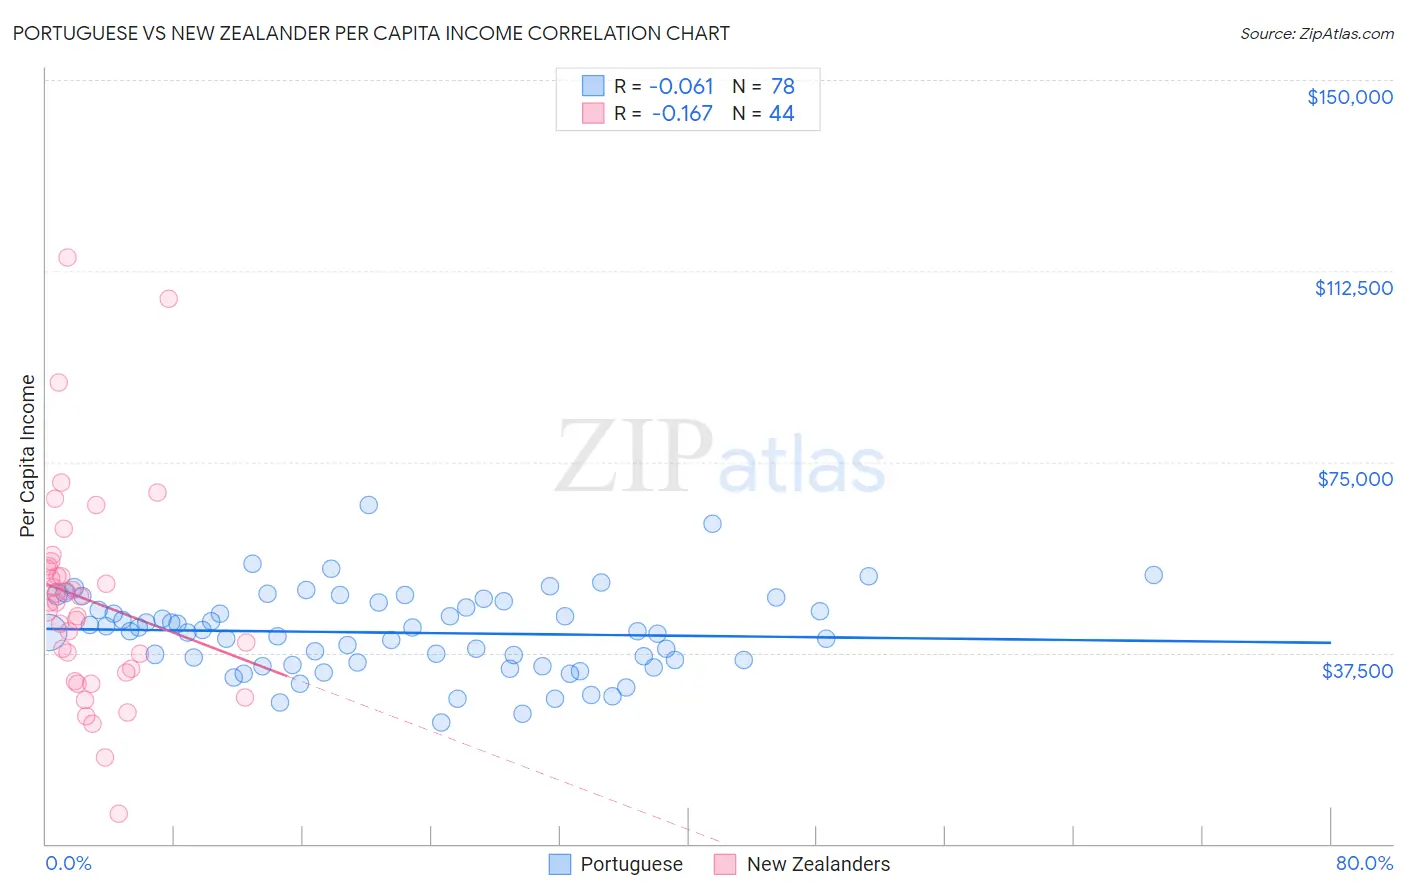
Portuguese vs New Zealander Per Capita Income Correlation Chart
The statistical analysis conducted on geographies consisting of 450,379,372 people shows a slight negative correlation between the proportion of Portuguese and per capita income in the United States with a correlation coefficient (R) of -0.061 and weighted average of $44,362. Similarly, the statistical analysis conducted on geographies consisting of 106,919,498 people shows a poor negative correlation between the proportion of New Zealanders and per capita income in the United States with a correlation coefficient (R) of -0.167 and weighted average of $50,575, a difference of 14.0%.
Per Capita Income Correlation Summary
| Measurement | Portuguese | New Zealander |
| Minimum | $23,853 | $5,784 |
| Maximum | $66,467 | $115,097 |
| Range | $42,614 | $109,313 |
| Mean | $41,456 | $47,922 |
| Median | $41,782 | $47,389 |
| Interquartile 25% (IQ1) | $35,480 | $34,042 |
| Interquartile 75% (IQ3) | $47,466 | $54,179 |
| Interquartile Range (IQR) | $11,986 | $20,137 |
| Standard Deviation (Sample) | $8,108 | $20,895 |
| Standard Deviation (Population) | $8,056 | $20,656 |
Similar Demographics by Per Capita Income
Demographics Similar to Portuguese by Per Capita Income
In terms of per capita income, the demographic groups most similar to Portuguese are Uruguayan ($44,318, a difference of 0.10%), Scottish ($44,440, a difference of 0.18%), Peruvian ($44,479, a difference of 0.26%), Norwegian ($44,480, a difference of 0.27%), and Slovak ($44,229, a difference of 0.30%).
| Demographics | Rating | Rank | Per Capita Income |
| Czechs | 74.1 /100 | #147 | Good $44,595 |
| Immigrants | Armenia | 73.1 /100 | #148 | Good $44,552 |
| Koreans | 72.5 /100 | #149 | Good $44,522 |
| Immigrants | Eritrea | 72.1 /100 | #150 | Good $44,509 |
| Norwegians | 71.5 /100 | #151 | Good $44,480 |
| Peruvians | 71.5 /100 | #152 | Good $44,479 |
| Scottish | 70.6 /100 | #153 | Good $44,440 |
| Portuguese | 68.7 /100 | #154 | Good $44,362 |
| Uruguayans | 67.6 /100 | #155 | Good $44,318 |
| Slovaks | 65.4 /100 | #156 | Good $44,229 |
| South American Indians | 64.8 /100 | #157 | Good $44,206 |
| Immigrants | Nepal | 64.3 /100 | #158 | Good $44,187 |
| South Americans | 62.4 /100 | #159 | Good $44,114 |
| Danes | 61.9 /100 | #160 | Good $44,095 |
| Costa Ricans | 61.8 /100 | #161 | Good $44,090 |
Demographics Similar to New Zealanders by Per Capita Income
In terms of per capita income, the demographic groups most similar to New Zealanders are Immigrants from Sri Lanka ($50,555, a difference of 0.040%), Immigrants from Netherlands ($50,458, a difference of 0.23%), Immigrants from Croatia ($50,417, a difference of 0.31%), Paraguayan ($50,385, a difference of 0.38%), and Immigrants from Serbia ($50,810, a difference of 0.46%).
| Demographics | Rating | Rank | Per Capita Income |
| Immigrants | Turkey | 100.0 /100 | #42 | Exceptional $51,368 |
| Immigrants | Lithuania | 100.0 /100 | #43 | Exceptional $51,361 |
| Immigrants | Europe | 100.0 /100 | #44 | Exceptional $50,950 |
| Immigrants | Spain | 100.0 /100 | #45 | Exceptional $50,933 |
| Immigrants | Latvia | 100.0 /100 | #46 | Exceptional $50,914 |
| Bulgarians | 100.0 /100 | #47 | Exceptional $50,906 |
| Immigrants | Serbia | 100.0 /100 | #48 | Exceptional $50,810 |
| New Zealanders | 100.0 /100 | #49 | Exceptional $50,575 |
| Immigrants | Sri Lanka | 100.0 /100 | #50 | Exceptional $50,555 |
| Immigrants | Netherlands | 100.0 /100 | #51 | Exceptional $50,458 |
| Immigrants | Croatia | 99.9 /100 | #52 | Exceptional $50,417 |
| Paraguayans | 99.9 /100 | #53 | Exceptional $50,385 |
| Immigrants | Belarus | 99.9 /100 | #54 | Exceptional $50,303 |
| Immigrants | Western Europe | 99.9 /100 | #55 | Exceptional $50,065 |
| Asians | 99.9 /100 | #56 | Exceptional $50,057 |