Pima vs Yuman 11th Grade
COMPARE
Pima
Yuman
11th Grade
11th Grade Comparison
Pima
Yuman
88.3%
11TH GRADE
0.0/ 100
METRIC RATING
323rd/ 347
METRIC RANK
89.7%
11TH GRADE
0.0/ 100
METRIC RATING
304th/ 347
METRIC RANK
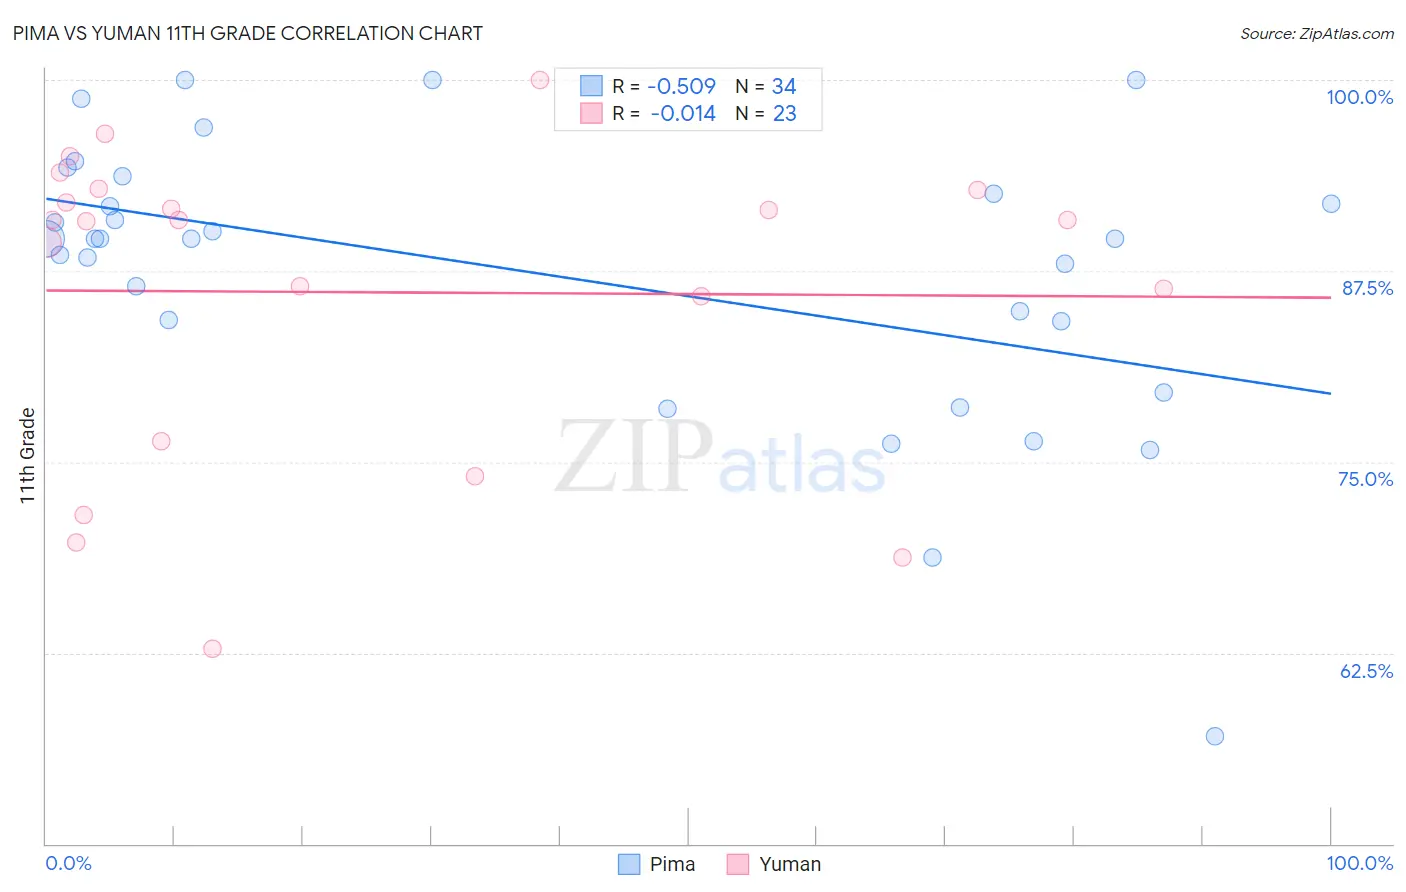
Pima vs Yuman 11th Grade Correlation Chart
The statistical analysis conducted on geographies consisting of 61,552,942 people shows a substantial negative correlation between the proportion of Pima and percentage of population with at least 11th grade education in the United States with a correlation coefficient (R) of -0.509 and weighted average of 88.3%. Similarly, the statistical analysis conducted on geographies consisting of 40,696,349 people shows no correlation between the proportion of Yuman and percentage of population with at least 11th grade education in the United States with a correlation coefficient (R) of -0.014 and weighted average of 89.7%, a difference of 1.6%.
11th Grade Correlation Summary
| Measurement | Pima | Yuman |
| Minimum | 57.0% | 62.7% |
| Maximum | 100.0% | 100.0% |
| Range | 43.0% | 37.3% |
| Mean | 87.3% | 86.1% |
| Median | 89.6% | 90.8% |
| Interquartile 25% (IQ1) | 84.2% | 76.3% |
| Interquartile 75% (IQ3) | 92.6% | 92.8% |
| Interquartile Range (IQR) | 8.4% | 16.5% |
| Standard Deviation (Sample) | 9.3% | 10.2% |
| Standard Deviation (Population) | 9.2% | 10.0% |
Demographics Similar to Pima and Yuman by 11th Grade
In terms of 11th grade, the demographic groups most similar to Pima are Puerto Rican (88.4%, a difference of 0.080%), Immigrants from Belize (88.7%, a difference of 0.47%), Immigrants from Armenia (88.8%, a difference of 0.55%), Belizean (88.8%, a difference of 0.58%), and Nicaraguan (88.9%, a difference of 0.67%). Similarly, the demographic groups most similar to Yuman are Immigrants (89.7%, a difference of 0.0%), Immigrants from Cambodia (89.6%, a difference of 0.080%), Ecuadorian (89.6%, a difference of 0.13%), Immigrants from Dominica (89.5%, a difference of 0.18%), and Nepalese (89.5%, a difference of 0.21%).
| Demographics | Rating | Rank | 11th Grade |
| Immigrants | Immigrants | 0.0 /100 | #303 | Tragic 89.7% |
| Yuman | 0.0 /100 | #304 | Tragic 89.7% |
| Immigrants | Cambodia | 0.0 /100 | #305 | Tragic 89.6% |
| Ecuadorians | 0.0 /100 | #306 | Tragic 89.6% |
| Immigrants | Dominica | 0.0 /100 | #307 | Tragic 89.5% |
| Nepalese | 0.0 /100 | #308 | Tragic 89.5% |
| Immigrants | Bangladesh | 0.0 /100 | #309 | Tragic 89.5% |
| Yaqui | 0.0 /100 | #310 | Tragic 89.5% |
| Vietnamese | 0.0 /100 | #311 | Tragic 89.4% |
| Immigrants | Portugal | 0.0 /100 | #312 | Tragic 89.3% |
| Immigrants | Caribbean | 0.0 /100 | #313 | Tragic 89.1% |
| Cape Verdeans | 0.0 /100 | #314 | Tragic 89.1% |
| Immigrants | Ecuador | 0.0 /100 | #315 | Tragic 89.1% |
| Immigrants | Cuba | 0.0 /100 | #316 | Tragic 88.9% |
| Lumbee | 0.0 /100 | #317 | Tragic 88.9% |
| Nicaraguans | 0.0 /100 | #318 | Tragic 88.9% |
| Belizeans | 0.0 /100 | #319 | Tragic 88.8% |
| Immigrants | Armenia | 0.0 /100 | #320 | Tragic 88.8% |
| Immigrants | Belize | 0.0 /100 | #321 | Tragic 88.7% |
| Puerto Ricans | 0.0 /100 | #322 | Tragic 88.4% |
| Pima | 0.0 /100 | #323 | Tragic 88.3% |