Hungarian vs Yugoslavian Median Female Earnings
COMPARE
Hungarian
Yugoslavian
Median Female Earnings
Median Female Earnings Comparison
Hungarians
Yugoslavians
$39,510
MEDIAN FEMALE EARNINGS
40.3/ 100
METRIC RATING
183rd/ 347
METRIC RANK
$38,573
MEDIAN FEMALE EARNINGS
8.8/ 100
METRIC RATING
220th/ 347
METRIC RANK
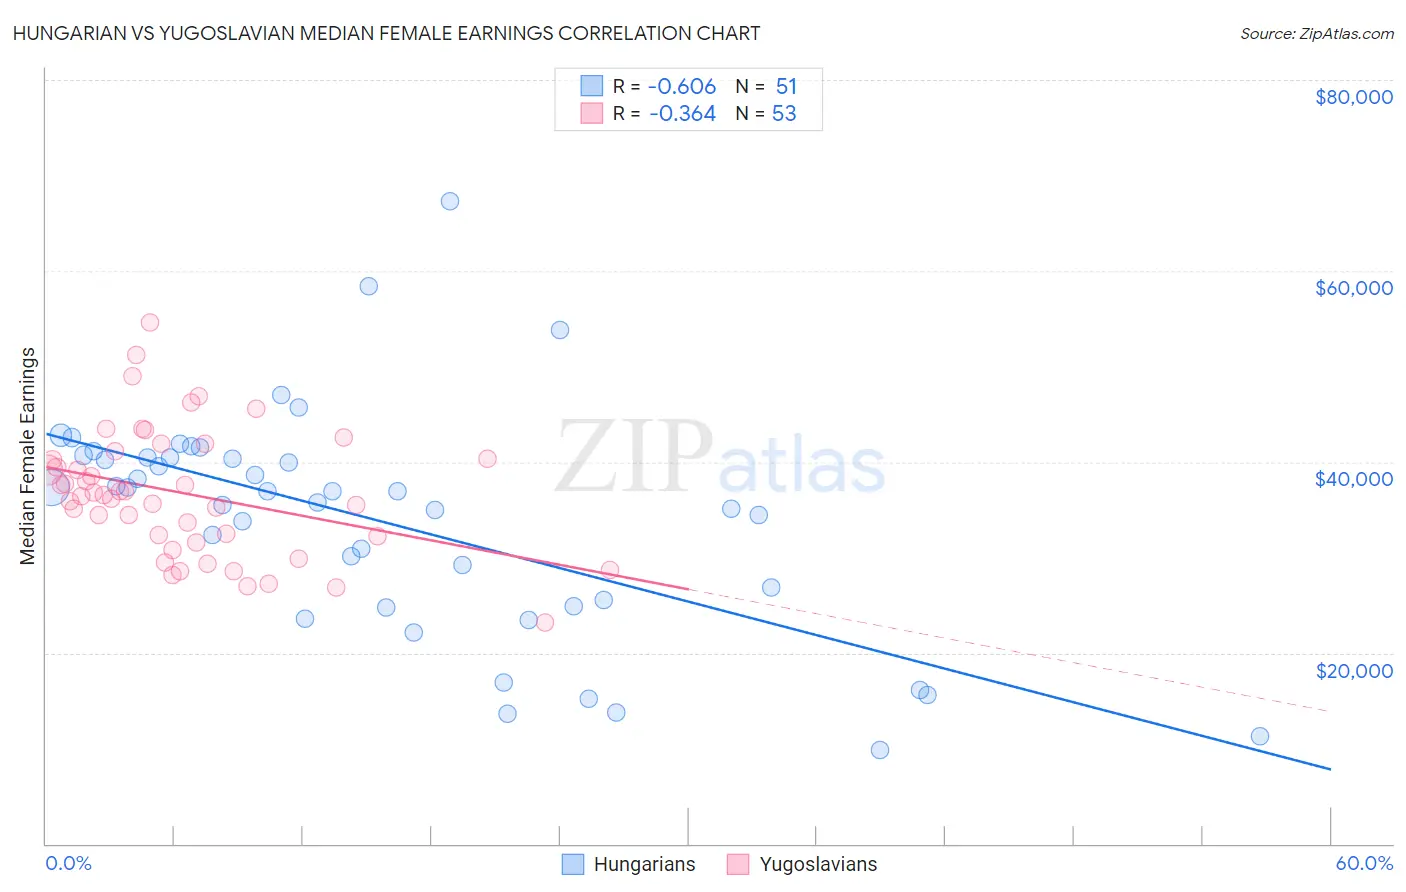
Hungarian vs Yugoslavian Median Female Earnings Correlation Chart
The statistical analysis conducted on geographies consisting of 485,733,652 people shows a significant negative correlation between the proportion of Hungarians and median female earnings in the United States with a correlation coefficient (R) of -0.606 and weighted average of $39,510. Similarly, the statistical analysis conducted on geographies consisting of 285,638,776 people shows a mild negative correlation between the proportion of Yugoslavians and median female earnings in the United States with a correlation coefficient (R) of -0.364 and weighted average of $38,573, a difference of 2.4%.
Median Female Earnings Correlation Summary
| Measurement | Hungarian | Yugoslavian |
| Minimum | $9,845 | $23,125 |
| Maximum | $67,329 | $54,556 |
| Range | $57,484 | $31,431 |
| Mean | $33,736 | $36,696 |
| Median | $36,875 | $36,579 |
| Interquartile 25% (IQ1) | $24,845 | $31,882 |
| Interquartile 75% (IQ3) | $40,519 | $40,715 |
| Interquartile Range (IQR) | $15,674 | $8,834 |
| Standard Deviation (Sample) | $11,915 | $6,632 |
| Standard Deviation (Population) | $11,798 | $6,570 |
Similar Demographics by Median Female Earnings
Demographics Similar to Hungarians by Median Female Earnings
In terms of median female earnings, the demographic groups most similar to Hungarians are Tlingit-Haida ($39,513, a difference of 0.010%), Tsimshian ($39,530, a difference of 0.050%), Immigrants from Kenya ($39,535, a difference of 0.060%), European ($39,457, a difference of 0.13%), and Immigrants from West Indies ($39,441, a difference of 0.18%).
| Demographics | Rating | Rank | Median Female Earnings |
| Nigerians | 47.0 /100 | #176 | Average $39,641 |
| Costa Ricans | 46.1 /100 | #177 | Average $39,622 |
| Slavs | 45.6 /100 | #178 | Average $39,613 |
| Immigrants | Germany | 45.1 /100 | #179 | Average $39,603 |
| Immigrants | Kenya | 41.6 /100 | #180 | Average $39,535 |
| Tsimshian | 41.4 /100 | #181 | Average $39,530 |
| Tlingit-Haida | 40.5 /100 | #182 | Average $39,513 |
| Hungarians | 40.3 /100 | #183 | Average $39,510 |
| Europeans | 37.7 /100 | #184 | Fair $39,457 |
| Immigrants | West Indies | 36.9 /100 | #185 | Fair $39,441 |
| Colombians | 36.9 /100 | #186 | Fair $39,439 |
| Swedes | 36.0 /100 | #187 | Fair $39,421 |
| Bermudans | 35.9 /100 | #188 | Fair $39,418 |
| Senegalese | 34.2 /100 | #189 | Fair $39,384 |
| Puget Sound Salish | 33.9 /100 | #190 | Fair $39,376 |
Demographics Similar to Yugoslavians by Median Female Earnings
In terms of median female earnings, the demographic groups most similar to Yugoslavians are Immigrants from the Azores ($38,573, a difference of 0.0%), Nepalese ($38,603, a difference of 0.080%), Cape Verdean ($38,614, a difference of 0.11%), Japanese ($38,528, a difference of 0.12%), and Immigrants from Jamaica ($38,625, a difference of 0.14%).
| Demographics | Rating | Rank | Median Female Earnings |
| Jamaicans | 10.5 /100 | #213 | Poor $38,670 |
| Iraqis | 10.5 /100 | #214 | Poor $38,666 |
| Spaniards | 10.3 /100 | #215 | Poor $38,656 |
| Immigrants | Ecuador | 10.1 /100 | #216 | Poor $38,644 |
| Immigrants | Jamaica | 9.7 /100 | #217 | Tragic $38,625 |
| Cape Verdeans | 9.5 /100 | #218 | Tragic $38,614 |
| Nepalese | 9.3 /100 | #219 | Tragic $38,603 |
| Yugoslavians | 8.8 /100 | #220 | Tragic $38,573 |
| Immigrants | Azores | 8.8 /100 | #221 | Tragic $38,573 |
| Japanese | 8.1 /100 | #222 | Tragic $38,528 |
| Immigrants | Sudan | 7.8 /100 | #223 | Tragic $38,511 |
| Native Hawaiians | 7.1 /100 | #224 | Tragic $38,461 |
| French | 7.0 /100 | #225 | Tragic $38,457 |
| French Canadians | 6.8 /100 | #226 | Tragic $38,436 |
| Scottish | 6.3 /100 | #227 | Tragic $38,397 |