Pima vs Russian Single Mother Poverty
COMPARE
Pima
Russian
Single Mother Poverty
Single Mother Poverty Comparison
Pima
Russians
38.6%
SINGLE MOTHER POVERTY
0.0/ 100
METRIC RATING
338th/ 347
METRIC RANK
27.3%
SINGLE MOTHER POVERTY
99.5/ 100
METRIC RATING
64th/ 347
METRIC RANK
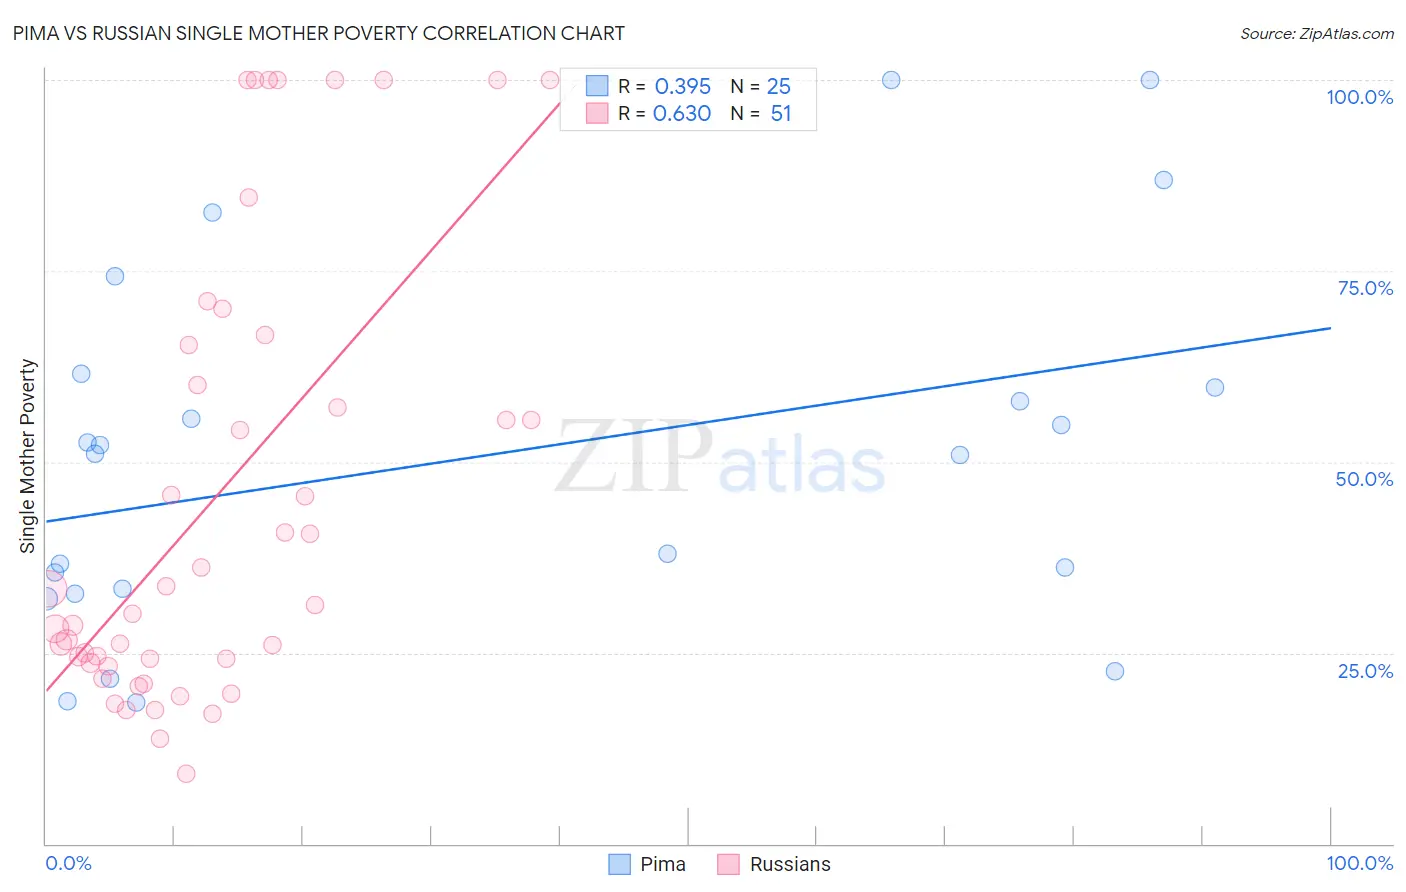
Pima vs Russian Single Mother Poverty Correlation Chart
The statistical analysis conducted on geographies consisting of 61,247,858 people shows a mild positive correlation between the proportion of Pima and poverty level among single mothers in the United States with a correlation coefficient (R) of 0.395 and weighted average of 38.6%. Similarly, the statistical analysis conducted on geographies consisting of 491,168,299 people shows a significant positive correlation between the proportion of Russians and poverty level among single mothers in the United States with a correlation coefficient (R) of 0.630 and weighted average of 27.3%, a difference of 41.3%.
Single Mother Poverty Correlation Summary
| Measurement | Pima | Russian |
| Minimum | 18.5% | 9.2% |
| Maximum | 100.0% | 100.0% |
| Range | 81.5% | 90.8% |
| Mean | 50.6% | 45.2% |
| Median | 51.0% | 31.2% |
| Interquartile 25% (IQ1) | 33.1% | 23.7% |
| Interquartile 75% (IQ3) | 60.6% | 65.4% |
| Interquartile Range (IQR) | 27.5% | 41.7% |
| Standard Deviation (Sample) | 23.7% | 29.2% |
| Standard Deviation (Population) | 23.3% | 28.9% |
Similar Demographics by Single Mother Poverty
Demographics Similar to Pima by Single Mother Poverty
In terms of single mother poverty, the demographic groups most similar to Pima are Crow (38.6%, a difference of 0.090%), Immigrants from Yemen (38.5%, a difference of 0.21%), Cheyenne (38.5%, a difference of 0.25%), Sioux (38.8%, a difference of 0.49%), and Colville (39.3%, a difference of 1.8%).
| Demographics | Rating | Rank | Single Mother Poverty |
| Creek | 0.0 /100 | #331 | Tragic 36.7% |
| Dutch West Indians | 0.0 /100 | #332 | Tragic 36.8% |
| Menominee | 0.0 /100 | #333 | Tragic 37.1% |
| Pueblo | 0.0 /100 | #334 | Tragic 37.2% |
| Yuman | 0.0 /100 | #335 | Tragic 37.8% |
| Cheyenne | 0.0 /100 | #336 | Tragic 38.5% |
| Immigrants | Yemen | 0.0 /100 | #337 | Tragic 38.5% |
| Pima | 0.0 /100 | #338 | Tragic 38.6% |
| Crow | 0.0 /100 | #339 | Tragic 38.6% |
| Sioux | 0.0 /100 | #340 | Tragic 38.8% |
| Colville | 0.0 /100 | #341 | Tragic 39.3% |
| Navajo | 0.0 /100 | #342 | Tragic 40.2% |
| Cajuns | 0.0 /100 | #343 | Tragic 40.3% |
| Tohono O'odham | 0.0 /100 | #344 | Tragic 43.0% |
| Lumbee | 0.0 /100 | #345 | Tragic 43.2% |
Demographics Similar to Russians by Single Mother Poverty
In terms of single mother poverty, the demographic groups most similar to Russians are Immigrants from Northern Europe (27.3%, a difference of 0.030%), Immigrants from Malaysia (27.3%, a difference of 0.080%), Immigrants from Turkey (27.3%, a difference of 0.080%), Soviet Union (27.3%, a difference of 0.12%), and Immigrants from Australia (27.3%, a difference of 0.14%).
| Demographics | Rating | Rank | Single Mother Poverty |
| Palestinians | 99.7 /100 | #57 | Exceptional 27.2% |
| Argentineans | 99.6 /100 | #58 | Exceptional 27.2% |
| Paraguayans | 99.6 /100 | #59 | Exceptional 27.2% |
| Eastern Europeans | 99.6 /100 | #60 | Exceptional 27.2% |
| Immigrants | Eastern Europe | 99.6 /100 | #61 | Exceptional 27.2% |
| Immigrants | Malaysia | 99.5 /100 | #62 | Exceptional 27.3% |
| Immigrants | Northern Europe | 99.5 /100 | #63 | Exceptional 27.3% |
| Russians | 99.5 /100 | #64 | Exceptional 27.3% |
| Immigrants | Turkey | 99.5 /100 | #65 | Exceptional 27.3% |
| Soviet Union | 99.5 /100 | #66 | Exceptional 27.3% |
| Immigrants | Australia | 99.5 /100 | #67 | Exceptional 27.3% |
| Immigrants | Czechoslovakia | 99.5 /100 | #68 | Exceptional 27.4% |
| Lithuanians | 99.4 /100 | #69 | Exceptional 27.4% |
| Immigrants | Belarus | 99.4 /100 | #70 | Exceptional 27.4% |
| Macedonians | 99.4 /100 | #71 | Exceptional 27.4% |