Pima vs Immigrants from England Female Poverty Among 18-24 Year Olds
COMPARE
Pima
Immigrants from England
Female Poverty Among 18-24 Year Olds
Female Poverty Among 18-24 Year Olds Comparison
Pima
Immigrants from England
28.4%
FEMALE POVERTY AMONG 18-24 YEAR OLDS
0.0/ 100
METRIC RATING
339th/ 347
METRIC RANK
19.5%
FEMALE POVERTY AMONG 18-24 YEAR OLDS
92.9/ 100
METRIC RATING
129th/ 347
METRIC RANK
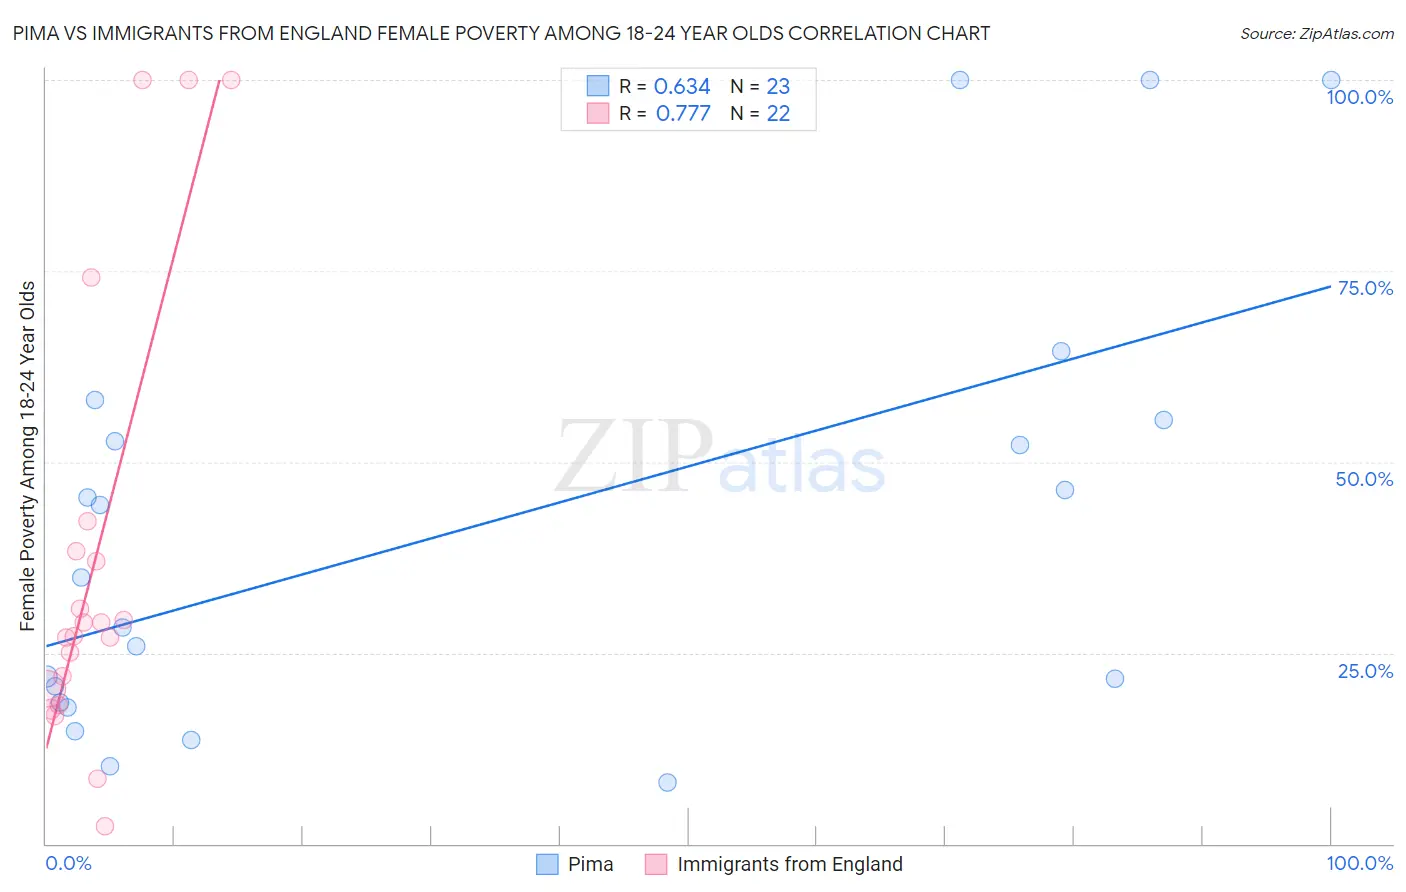
Pima vs Immigrants from England Female Poverty Among 18-24 Year Olds Correlation Chart
The statistical analysis conducted on geographies consisting of 61,293,742 people shows a significant positive correlation between the proportion of Pima and poverty level among females between the ages 18 and 24 in the United States with a correlation coefficient (R) of 0.634 and weighted average of 28.4%. Similarly, the statistical analysis conducted on geographies consisting of 380,023,183 people shows a strong positive correlation between the proportion of Immigrants from England and poverty level among females between the ages 18 and 24 in the United States with a correlation coefficient (R) of 0.777 and weighted average of 19.5%, a difference of 45.9%.
Female Poverty Among 18-24 Year Olds Correlation Summary
| Measurement | Pima | Immigrants from England |
| Minimum | 8.0% | 2.2% |
| Maximum | 100.0% | 100.0% |
| Range | 92.0% | 97.8% |
| Mean | 41.5% | 37.3% |
| Median | 34.9% | 28.1% |
| Interquartile 25% (IQ1) | 18.5% | 20.3% |
| Interquartile 75% (IQ3) | 55.5% | 38.2% |
| Interquartile Range (IQR) | 37.0% | 18.0% |
| Standard Deviation (Sample) | 28.5% | 29.0% |
| Standard Deviation (Population) | 27.9% | 28.3% |
Similar Demographics by Female Poverty Among 18-24 Year Olds
Demographics Similar to Pima by Female Poverty Among 18-24 Year Olds
In terms of female poverty among 18-24 year olds, the demographic groups most similar to Pima are Sioux (28.6%, a difference of 0.55%), Hopi (28.2%, a difference of 0.72%), Cheyenne (28.1%, a difference of 0.94%), Colville (29.0%, a difference of 2.1%), and Kiowa (29.2%, a difference of 2.9%).
| Demographics | Rating | Rank | Female Poverty Among 18-24 Year Olds |
| Houma | 0.0 /100 | #332 | Tragic 26.2% |
| Apache | 0.0 /100 | #333 | Tragic 26.3% |
| Pueblo | 0.0 /100 | #334 | Tragic 26.9% |
| Yup'ik | 0.0 /100 | #335 | Tragic 27.0% |
| Immigrants | Yemen | 0.0 /100 | #336 | Tragic 27.5% |
| Cheyenne | 0.0 /100 | #337 | Tragic 28.1% |
| Hopi | 0.0 /100 | #338 | Tragic 28.2% |
| Pima | 0.0 /100 | #339 | Tragic 28.4% |
| Sioux | 0.0 /100 | #340 | Tragic 28.6% |
| Colville | 0.0 /100 | #341 | Tragic 29.0% |
| Kiowa | 0.0 /100 | #342 | Tragic 29.2% |
| Puerto Ricans | 0.0 /100 | #343 | Tragic 29.8% |
| Navajo | 0.0 /100 | #344 | Tragic 30.3% |
| Tohono O'odham | 0.0 /100 | #345 | Tragic 31.0% |
| Lumbee | 0.0 /100 | #346 | Tragic 31.1% |
Demographics Similar to Immigrants from England by Female Poverty Among 18-24 Year Olds
In terms of female poverty among 18-24 year olds, the demographic groups most similar to Immigrants from England are Slovak (19.5%, a difference of 0.0%), Immigrants from Canada (19.5%, a difference of 0.0%), Latvian (19.5%, a difference of 0.040%), Cape Verdean (19.4%, a difference of 0.14%), and Jamaican (19.5%, a difference of 0.15%).
| Demographics | Rating | Rank | Female Poverty Among 18-24 Year Olds |
| Cambodians | 94.6 /100 | #122 | Exceptional 19.4% |
| Paraguayans | 94.6 /100 | #123 | Exceptional 19.4% |
| Immigrants | Chile | 94.3 /100 | #124 | Exceptional 19.4% |
| Immigrants | Panama | 94.0 /100 | #125 | Exceptional 19.4% |
| Immigrants | Russia | 93.7 /100 | #126 | Exceptional 19.4% |
| Cape Verdeans | 93.6 /100 | #127 | Exceptional 19.4% |
| Slovaks | 92.9 /100 | #128 | Exceptional 19.5% |
| Immigrants | England | 92.9 /100 | #129 | Exceptional 19.5% |
| Immigrants | Canada | 92.9 /100 | #130 | Exceptional 19.5% |
| Latvians | 92.7 /100 | #131 | Exceptional 19.5% |
| Jamaicans | 92.1 /100 | #132 | Exceptional 19.5% |
| Turks | 92.1 /100 | #133 | Exceptional 19.5% |
| Immigrants | North America | 92.1 /100 | #134 | Exceptional 19.5% |
| Soviet Union | 92.0 /100 | #135 | Exceptional 19.5% |
| Russians | 91.5 /100 | #136 | Exceptional 19.5% |