Peruvian vs Immigrants from Netherlands Median Male Earnings
COMPARE
Peruvian
Immigrants from Netherlands
Median Male Earnings
Median Male Earnings Comparison
Peruvians
Immigrants from Netherlands
$55,659
MEDIAN MALE EARNINGS
75.8/ 100
METRIC RATING
152nd/ 347
METRIC RANK
$61,096
MEDIAN MALE EARNINGS
99.8/ 100
METRIC RATING
59th/ 347
METRIC RANK
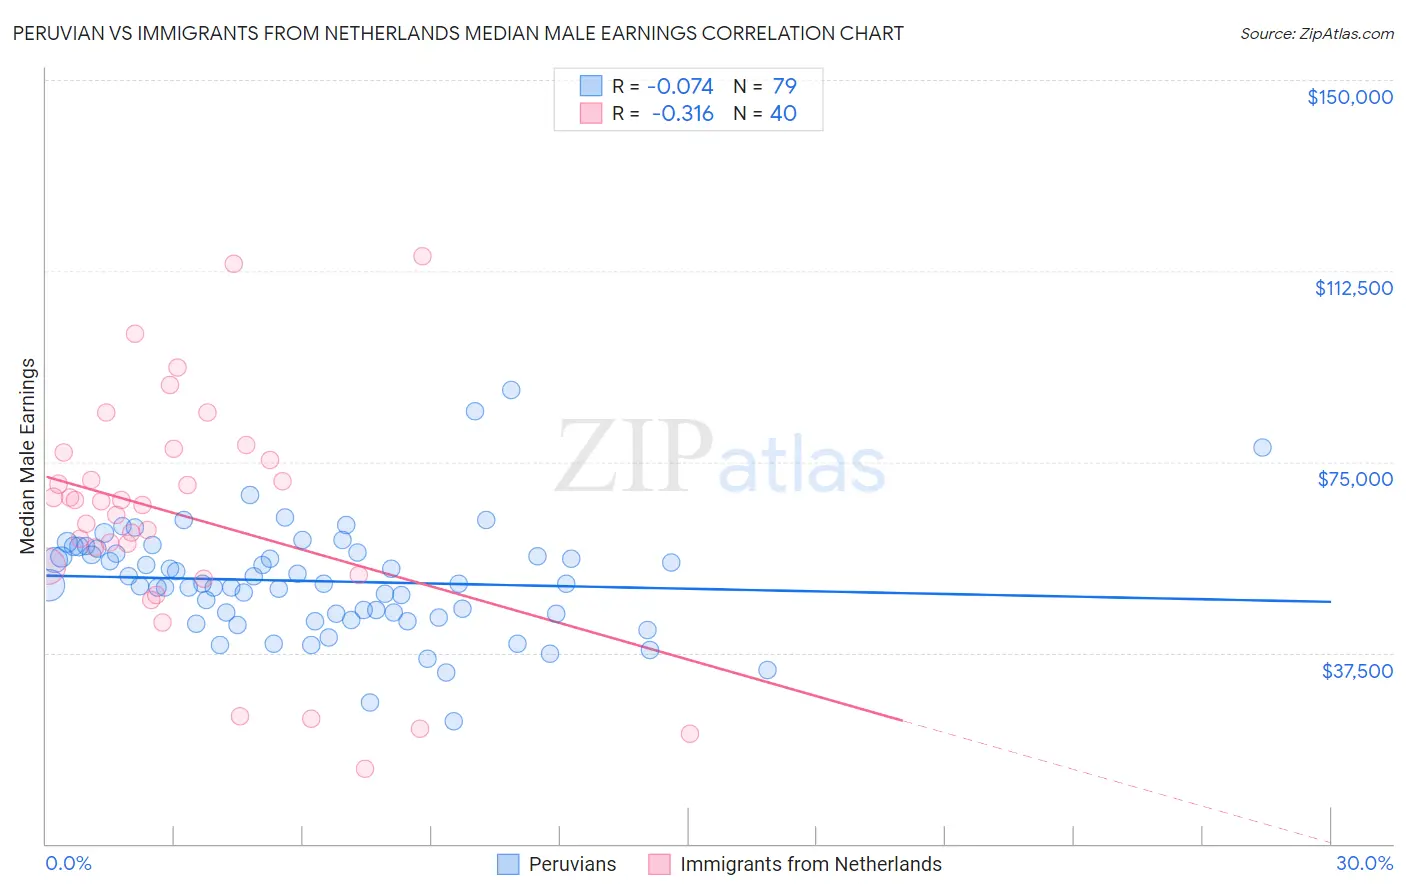
Peruvian vs Immigrants from Netherlands Median Male Earnings Correlation Chart
The statistical analysis conducted on geographies consisting of 363,195,834 people shows a slight negative correlation between the proportion of Peruvians and median male earnings in the United States with a correlation coefficient (R) of -0.074 and weighted average of $55,659. Similarly, the statistical analysis conducted on geographies consisting of 237,827,633 people shows a mild negative correlation between the proportion of Immigrants from Netherlands and median male earnings in the United States with a correlation coefficient (R) of -0.316 and weighted average of $61,096, a difference of 9.8%.
Median Male Earnings Correlation Summary
| Measurement | Peruvian | Immigrants from Netherlands |
| Minimum | $23,965 | $14,643 |
| Maximum | $89,196 | $115,494 |
| Range | $65,231 | $100,851 |
| Mean | $51,595 | $64,341 |
| Median | $51,069 | $66,907 |
| Interquartile 25% (IQ1) | $45,232 | $53,639 |
| Interquartile 75% (IQ3) | $57,176 | $76,092 |
| Interquartile Range (IQR) | $11,944 | $22,453 |
| Standard Deviation (Sample) | $10,827 | $22,767 |
| Standard Deviation (Population) | $10,758 | $22,481 |
Similar Demographics by Median Male Earnings
Demographics Similar to Peruvians by Median Male Earnings
In terms of median male earnings, the demographic groups most similar to Peruvians are Immigrants from Nepal ($55,615, a difference of 0.080%), Immigrants from Oceania ($55,712, a difference of 0.10%), Swiss ($55,731, a difference of 0.13%), English ($55,747, a difference of 0.16%), and Taiwanese ($55,556, a difference of 0.19%).
| Demographics | Rating | Rank | Median Male Earnings |
| Norwegians | 80.9 /100 | #145 | Excellent $55,965 |
| Immigrants | Chile | 80.7 /100 | #146 | Excellent $55,954 |
| Immigrants | Philippines | 78.4 /100 | #147 | Good $55,809 |
| Scottish | 78.2 /100 | #148 | Good $55,793 |
| English | 77.4 /100 | #149 | Good $55,747 |
| Swiss | 77.1 /100 | #150 | Good $55,731 |
| Immigrants | Oceania | 76.8 /100 | #151 | Good $55,712 |
| Peruvians | 75.8 /100 | #152 | Good $55,659 |
| Immigrants | Nepal | 75.0 /100 | #153 | Good $55,615 |
| Taiwanese | 73.9 /100 | #154 | Good $55,556 |
| Scandinavians | 73.4 /100 | #155 | Good $55,527 |
| Immigrants | Ethiopia | 71.6 /100 | #156 | Good $55,434 |
| Icelanders | 71.2 /100 | #157 | Good $55,415 |
| Czechoslovakians | 70.5 /100 | #158 | Good $55,382 |
| Alsatians | 70.5 /100 | #159 | Good $55,380 |
Demographics Similar to Immigrants from Netherlands by Median Male Earnings
In terms of median male earnings, the demographic groups most similar to Immigrants from Netherlands are Egyptian ($61,095, a difference of 0.0%), Bolivian ($61,066, a difference of 0.050%), Immigrants from Romania ($61,040, a difference of 0.090%), New Zealander ($61,199, a difference of 0.17%), and Immigrants from Pakistan ($60,987, a difference of 0.18%).
| Demographics | Rating | Rank | Median Male Earnings |
| Immigrants | Norway | 99.9 /100 | #52 | Exceptional $61,628 |
| South Africans | 99.9 /100 | #53 | Exceptional $61,460 |
| Immigrants | Latvia | 99.9 /100 | #54 | Exceptional $61,422 |
| Greeks | 99.9 /100 | #55 | Exceptional $61,242 |
| Lithuanians | 99.9 /100 | #56 | Exceptional $61,228 |
| Immigrants | Scotland | 99.9 /100 | #57 | Exceptional $61,220 |
| New Zealanders | 99.9 /100 | #58 | Exceptional $61,199 |
| Immigrants | Netherlands | 99.8 /100 | #59 | Exceptional $61,096 |
| Egyptians | 99.8 /100 | #60 | Exceptional $61,095 |
| Bolivians | 99.8 /100 | #61 | Exceptional $61,066 |
| Immigrants | Romania | 99.8 /100 | #62 | Exceptional $61,040 |
| Immigrants | Pakistan | 99.8 /100 | #63 | Exceptional $60,987 |
| Immigrants | Eastern Europe | 99.8 /100 | #64 | Exceptional $60,958 |
| Immigrants | Indonesia | 99.8 /100 | #65 | Exceptional $60,935 |
| Immigrants | Croatia | 99.8 /100 | #66 | Exceptional $60,914 |