Maltese vs Immigrants from Netherlands Wage/Income Gap
COMPARE
Maltese
Immigrants from Netherlands
Wage/Income Gap
Wage/Income Gap Comparison
Maltese
Immigrants from Netherlands
28.7%
WAGE/INCOME GAP
0.1/ 100
METRIC RATING
315th/ 347
METRIC RANK
28.5%
WAGE/INCOME GAP
0.2/ 100
METRIC RATING
304th/ 347
METRIC RANK
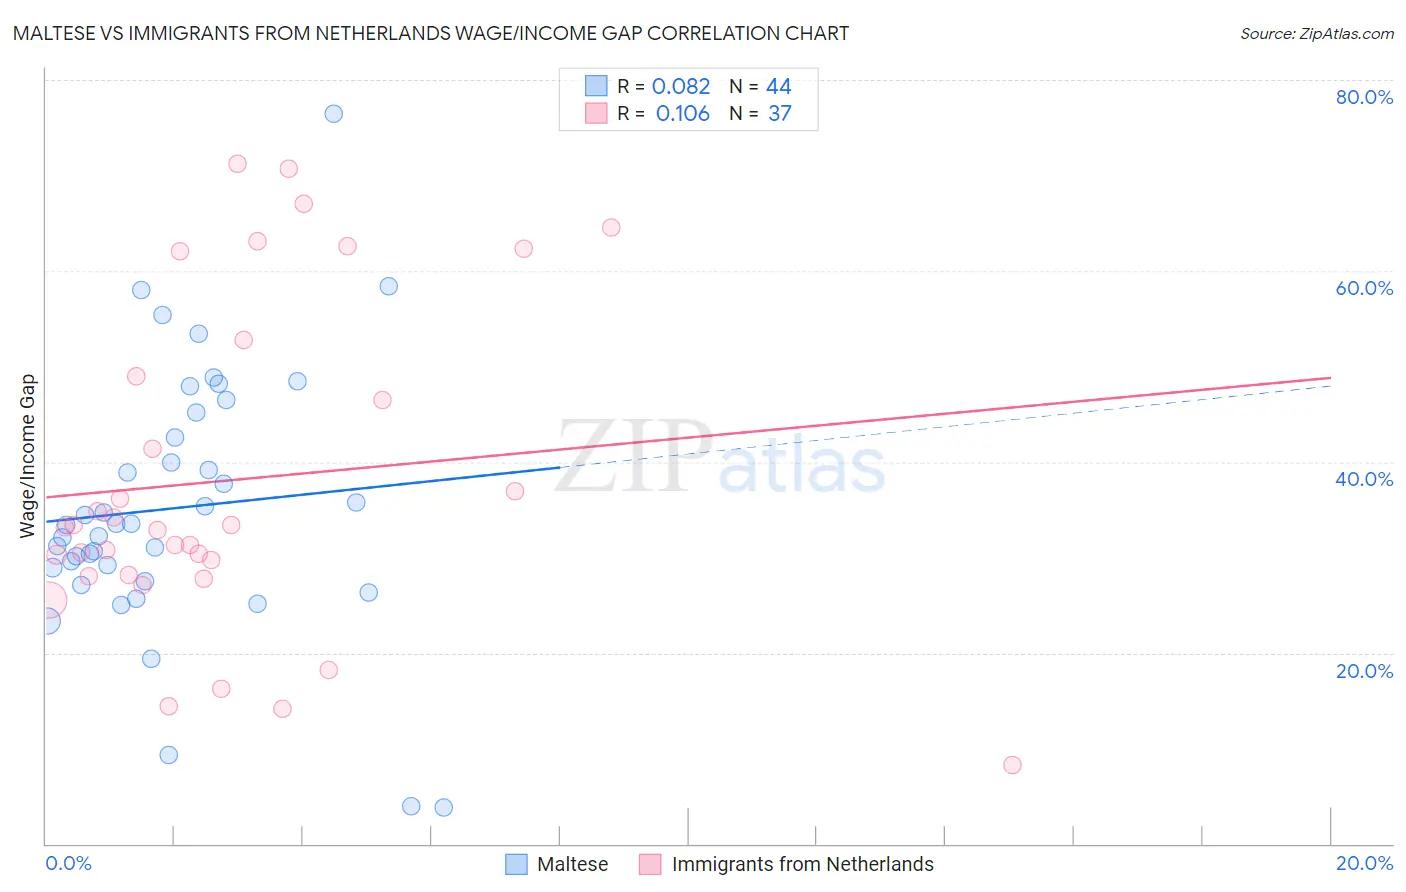
Maltese vs Immigrants from Netherlands Wage/Income Gap Correlation Chart
The statistical analysis conducted on geographies consisting of 126,452,733 people shows a slight positive correlation between the proportion of Maltese and wage/income gap percentage in the United States with a correlation coefficient (R) of 0.082 and weighted average of 28.7%. Similarly, the statistical analysis conducted on geographies consisting of 237,766,220 people shows a poor positive correlation between the proportion of Immigrants from Netherlands and wage/income gap percentage in the United States with a correlation coefficient (R) of 0.106 and weighted average of 28.5%, a difference of 0.85%.
Wage/Income Gap Correlation Summary
| Measurement | Maltese | Immigrants from Netherlands |
| Minimum | 3.8% | 8.2% |
| Maximum | 76.5% | 71.2% |
| Range | 72.8% | 63.0% |
| Mean | 35.2% | 38.1% |
| Median | 33.4% | 33.2% |
| Interquartile 25% (IQ1) | 28.2% | 28.1% |
| Interquartile 75% (IQ3) | 43.9% | 50.9% |
| Interquartile Range (IQR) | 15.7% | 22.8% |
| Standard Deviation (Sample) | 13.9% | 17.1% |
| Standard Deviation (Population) | 13.7% | 16.9% |
Demographics Similar to Maltese and Immigrants from Netherlands by Wage/Income Gap
In terms of wage/income gap, the demographic groups most similar to Maltese are Lithuanian (28.7%, a difference of 0.010%), Immigrants from Scotland (28.7%, a difference of 0.050%), Belgian (28.8%, a difference of 0.12%), Basque (28.8%, a difference of 0.17%), and French (28.7%, a difference of 0.19%). Similarly, the demographic groups most similar to Immigrants from Netherlands are Immigrants from South Africa (28.5%, a difference of 0.020%), White/Caucasian (28.5%, a difference of 0.060%), Immigrants from Denmark (28.5%, a difference of 0.070%), Scotch-Irish (28.5%, a difference of 0.080%), and Irish (28.5%, a difference of 0.080%).
| Demographics | Rating | Rank | Wage/Income Gap |
| Immigrants | North Macedonia | 0.2 /100 | #299 | Tragic 28.4% |
| Immigrants | Northern Europe | 0.2 /100 | #300 | Tragic 28.5% |
| Immigrants | Canada | 0.2 /100 | #301 | Tragic 28.5% |
| Scotch-Irish | 0.2 /100 | #302 | Tragic 28.5% |
| Irish | 0.2 /100 | #303 | Tragic 28.5% |
| Immigrants | Netherlands | 0.2 /100 | #304 | Tragic 28.5% |
| Immigrants | South Africa | 0.1 /100 | #305 | Tragic 28.5% |
| Whites/Caucasians | 0.1 /100 | #306 | Tragic 28.5% |
| Immigrants | Denmark | 0.1 /100 | #307 | Tragic 28.5% |
| Poles | 0.1 /100 | #308 | Tragic 28.5% |
| Macedonians | 0.1 /100 | #309 | Tragic 28.6% |
| Finns | 0.1 /100 | #310 | Tragic 28.6% |
| Immigrants | Lithuania | 0.1 /100 | #311 | Tragic 28.6% |
| Eastern Europeans | 0.1 /100 | #312 | Tragic 28.6% |
| French | 0.1 /100 | #313 | Tragic 28.7% |
| Immigrants | Scotland | 0.1 /100 | #314 | Tragic 28.7% |
| Maltese | 0.1 /100 | #315 | Tragic 28.7% |
| Lithuanians | 0.1 /100 | #316 | Tragic 28.7% |
| Belgians | 0.1 /100 | #317 | Tragic 28.8% |
| Basques | 0.1 /100 | #318 | Tragic 28.8% |
| Slovaks | 0.1 /100 | #319 | Tragic 28.9% |