Paraguayan vs Immigrants from El Salvador Median Female Earnings
COMPARE
Paraguayan
Immigrants from El Salvador
Median Female Earnings
Median Female Earnings Comparison
Paraguayans
Immigrants from El Salvador
$43,173
MEDIAN FEMALE EARNINGS
99.9/ 100
METRIC RATING
58th/ 347
METRIC RANK
$36,673
MEDIAN FEMALE EARNINGS
0.2/ 100
METRIC RATING
274th/ 347
METRIC RANK
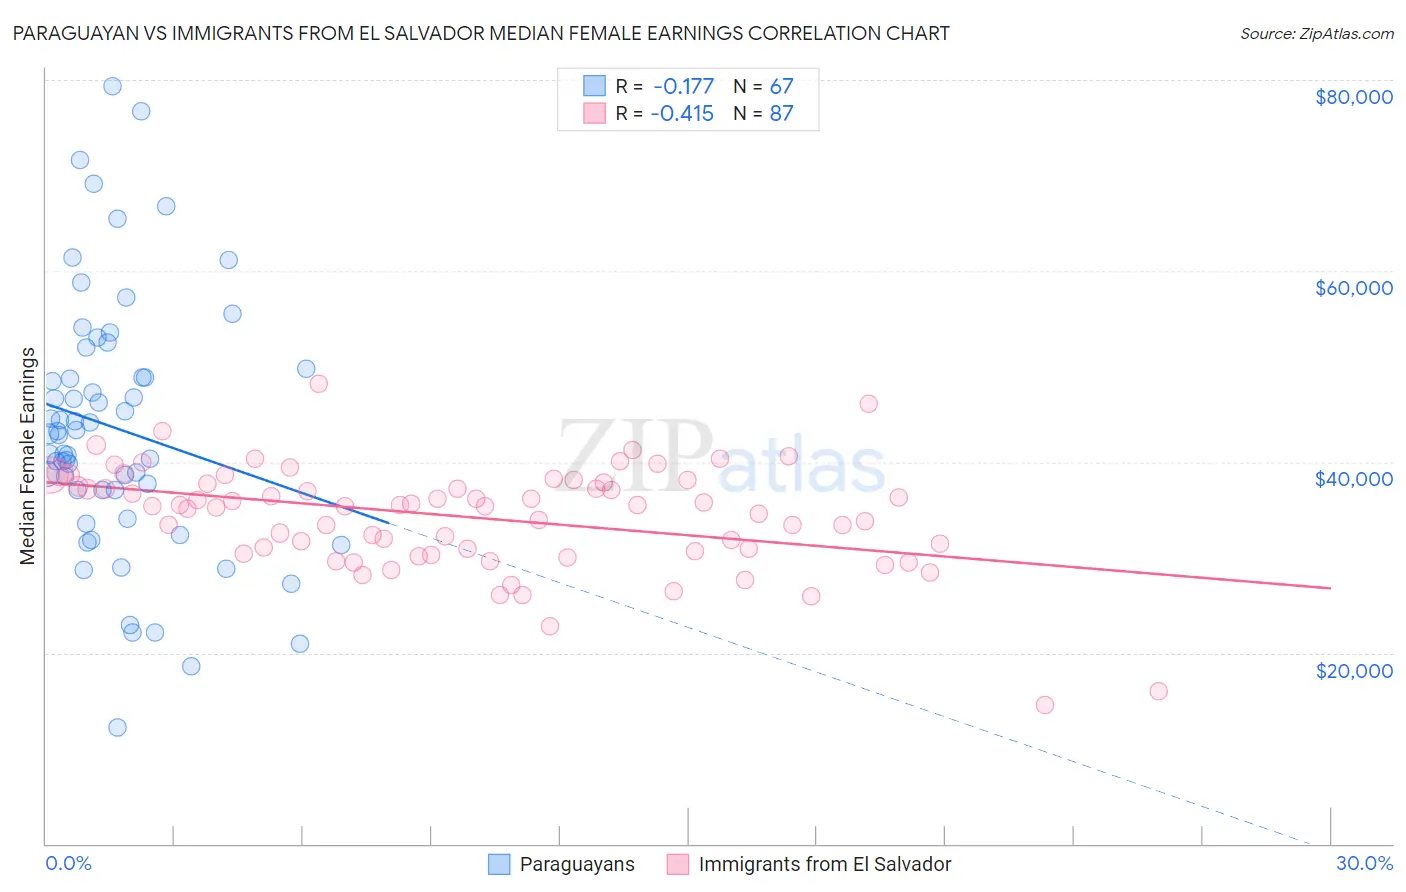
Paraguayan vs Immigrants from El Salvador Median Female Earnings Correlation Chart
The statistical analysis conducted on geographies consisting of 95,111,705 people shows a poor negative correlation between the proportion of Paraguayans and median female earnings in the United States with a correlation coefficient (R) of -0.177 and weighted average of $43,173. Similarly, the statistical analysis conducted on geographies consisting of 357,700,398 people shows a moderate negative correlation between the proportion of Immigrants from El Salvador and median female earnings in the United States with a correlation coefficient (R) of -0.415 and weighted average of $36,673, a difference of 17.7%.
Median Female Earnings Correlation Summary
| Measurement | Paraguayan | Immigrants from El Salvador |
| Minimum | $12,152 | $14,546 |
| Maximum | $79,410 | $48,246 |
| Range | $67,258 | $33,701 |
| Mean | $43,505 | $34,218 |
| Median | $42,896 | $35,415 |
| Interquartile 25% (IQ1) | $37,010 | $30,625 |
| Interquartile 75% (IQ3) | $49,789 | $37,872 |
| Interquartile Range (IQR) | $12,779 | $7,247 |
| Standard Deviation (Sample) | $13,576 | $5,551 |
| Standard Deviation (Population) | $13,475 | $5,519 |
Similar Demographics by Median Female Earnings
Demographics Similar to Paraguayans by Median Female Earnings
In terms of median female earnings, the demographic groups most similar to Paraguayans are Ethiopian ($43,243, a difference of 0.16%), Estonian ($43,106, a difference of 0.16%), Immigrants from Latvia ($43,099, a difference of 0.17%), Immigrants from Croatia ($43,258, a difference of 0.20%), and Immigrants from Bulgaria ($43,085, a difference of 0.20%).
| Demographics | Rating | Rank | Median Female Earnings |
| Maltese | 100.0 /100 | #51 | Exceptional $43,357 |
| Immigrants | Lithuania | 99.9 /100 | #52 | Exceptional $43,317 |
| Immigrants | Eastern Europe | 99.9 /100 | #53 | Exceptional $43,309 |
| Australians | 99.9 /100 | #54 | Exceptional $43,308 |
| Egyptians | 99.9 /100 | #55 | Exceptional $43,305 |
| Immigrants | Croatia | 99.9 /100 | #56 | Exceptional $43,258 |
| Ethiopians | 99.9 /100 | #57 | Exceptional $43,243 |
| Paraguayans | 99.9 /100 | #58 | Exceptional $43,173 |
| Estonians | 99.9 /100 | #59 | Exceptional $43,106 |
| Immigrants | Latvia | 99.9 /100 | #60 | Exceptional $43,099 |
| Immigrants | Bulgaria | 99.9 /100 | #61 | Exceptional $43,085 |
| Afghans | 99.9 /100 | #62 | Exceptional $43,077 |
| Immigrants | Ukraine | 99.9 /100 | #63 | Exceptional $43,069 |
| Immigrants | Pakistan | 99.9 /100 | #64 | Exceptional $43,052 |
| Sierra Leoneans | 99.9 /100 | #65 | Exceptional $42,868 |
Demographics Similar to Immigrants from El Salvador by Median Female Earnings
In terms of median female earnings, the demographic groups most similar to Immigrants from El Salvador are African ($36,530, a difference of 0.39%), Immigrants from Laos ($36,841, a difference of 0.46%), Central American ($36,492, a difference of 0.49%), Immigrants from Dominican Republic ($36,857, a difference of 0.50%), and Marshallese ($36,459, a difference of 0.59%).
| Demographics | Rating | Rank | Median Female Earnings |
| Immigrants | Nonimmigrants | 0.4 /100 | #267 | Tragic $37,024 |
| Cree | 0.4 /100 | #268 | Tragic $37,018 |
| Immigrants | Venezuela | 0.4 /100 | #269 | Tragic $37,003 |
| French American Indians | 0.3 /100 | #270 | Tragic $36,920 |
| Nicaraguans | 0.3 /100 | #271 | Tragic $36,904 |
| Immigrants | Dominican Republic | 0.3 /100 | #272 | Tragic $36,857 |
| Immigrants | Laos | 0.3 /100 | #273 | Tragic $36,841 |
| Immigrants | El Salvador | 0.2 /100 | #274 | Tragic $36,673 |
| Africans | 0.1 /100 | #275 | Tragic $36,530 |
| Central Americans | 0.1 /100 | #276 | Tragic $36,492 |
| Marshallese | 0.1 /100 | #277 | Tragic $36,459 |
| U.S. Virgin Islanders | 0.1 /100 | #278 | Tragic $36,424 |
| Immigrants | Caribbean | 0.1 /100 | #279 | Tragic $36,414 |
| Iroquois | 0.1 /100 | #280 | Tragic $36,408 |
| Spanish Americans | 0.1 /100 | #281 | Tragic $36,391 |