Paraguayan vs Immigrants from Bahamas Median Female Earnings
COMPARE
Paraguayan
Immigrants from Bahamas
Median Female Earnings
Median Female Earnings Comparison
Paraguayans
Immigrants from Bahamas
$43,173
MEDIAN FEMALE EARNINGS
99.9/ 100
METRIC RATING
58th/ 347
METRIC RANK
$35,027
MEDIAN FEMALE EARNINGS
0.0/ 100
METRIC RATING
308th/ 347
METRIC RANK
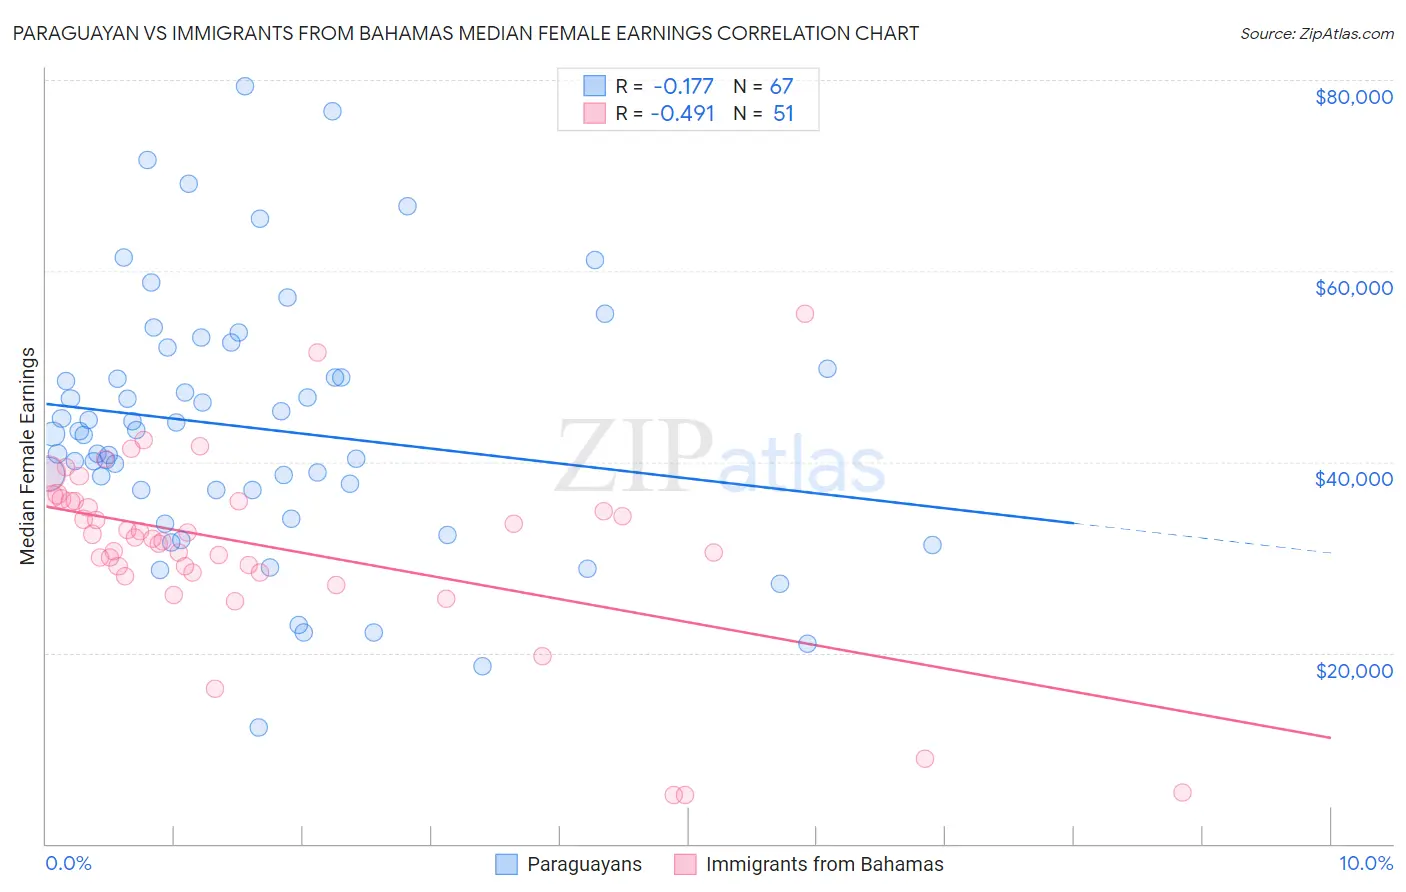
Paraguayan vs Immigrants from Bahamas Median Female Earnings Correlation Chart
The statistical analysis conducted on geographies consisting of 95,111,705 people shows a poor negative correlation between the proportion of Paraguayans and median female earnings in the United States with a correlation coefficient (R) of -0.177 and weighted average of $43,173. Similarly, the statistical analysis conducted on geographies consisting of 104,633,712 people shows a moderate negative correlation between the proportion of Immigrants from Bahamas and median female earnings in the United States with a correlation coefficient (R) of -0.491 and weighted average of $35,027, a difference of 23.3%.
Median Female Earnings Correlation Summary
| Measurement | Paraguayan | Immigrants from Bahamas |
| Minimum | $12,152 | $5,063 |
| Maximum | $79,410 | $55,500 |
| Range | $67,258 | $50,437 |
| Mean | $43,505 | $31,145 |
| Median | $42,896 | $32,119 |
| Interquartile 25% (IQ1) | $37,010 | $28,361 |
| Interquartile 75% (IQ3) | $49,789 | $35,940 |
| Interquartile Range (IQR) | $12,779 | $7,579 |
| Standard Deviation (Sample) | $13,576 | $9,851 |
| Standard Deviation (Population) | $13,475 | $9,754 |
Similar Demographics by Median Female Earnings
Demographics Similar to Paraguayans by Median Female Earnings
In terms of median female earnings, the demographic groups most similar to Paraguayans are Ethiopian ($43,243, a difference of 0.16%), Estonian ($43,106, a difference of 0.16%), Immigrants from Latvia ($43,099, a difference of 0.17%), Immigrants from Croatia ($43,258, a difference of 0.20%), and Immigrants from Bulgaria ($43,085, a difference of 0.20%).
| Demographics | Rating | Rank | Median Female Earnings |
| Maltese | 100.0 /100 | #51 | Exceptional $43,357 |
| Immigrants | Lithuania | 99.9 /100 | #52 | Exceptional $43,317 |
| Immigrants | Eastern Europe | 99.9 /100 | #53 | Exceptional $43,309 |
| Australians | 99.9 /100 | #54 | Exceptional $43,308 |
| Egyptians | 99.9 /100 | #55 | Exceptional $43,305 |
| Immigrants | Croatia | 99.9 /100 | #56 | Exceptional $43,258 |
| Ethiopians | 99.9 /100 | #57 | Exceptional $43,243 |
| Paraguayans | 99.9 /100 | #58 | Exceptional $43,173 |
| Estonians | 99.9 /100 | #59 | Exceptional $43,106 |
| Immigrants | Latvia | 99.9 /100 | #60 | Exceptional $43,099 |
| Immigrants | Bulgaria | 99.9 /100 | #61 | Exceptional $43,085 |
| Afghans | 99.9 /100 | #62 | Exceptional $43,077 |
| Immigrants | Ukraine | 99.9 /100 | #63 | Exceptional $43,069 |
| Immigrants | Pakistan | 99.9 /100 | #64 | Exceptional $43,052 |
| Sierra Leoneans | 99.9 /100 | #65 | Exceptional $42,868 |
Demographics Similar to Immigrants from Bahamas by Median Female Earnings
In terms of median female earnings, the demographic groups most similar to Immigrants from Bahamas are Honduran ($35,013, a difference of 0.040%), Chippewa ($35,003, a difference of 0.070%), Sioux ($35,063, a difference of 0.10%), Ute ($34,960, a difference of 0.19%), and Yaqui ($34,943, a difference of 0.24%).
| Demographics | Rating | Rank | Median Female Earnings |
| Pima | 0.0 /100 | #301 | Tragic $35,326 |
| Blacks/African Americans | 0.0 /100 | #302 | Tragic $35,315 |
| Immigrants | Latin America | 0.0 /100 | #303 | Tragic $35,307 |
| Crow | 0.0 /100 | #304 | Tragic $35,266 |
| Bahamians | 0.0 /100 | #305 | Tragic $35,125 |
| Fijians | 0.0 /100 | #306 | Tragic $35,114 |
| Sioux | 0.0 /100 | #307 | Tragic $35,063 |
| Immigrants | Bahamas | 0.0 /100 | #308 | Tragic $35,027 |
| Hondurans | 0.0 /100 | #309 | Tragic $35,013 |
| Chippewa | 0.0 /100 | #310 | Tragic $35,003 |
| Ute | 0.0 /100 | #311 | Tragic $34,960 |
| Yaqui | 0.0 /100 | #312 | Tragic $34,943 |
| Cubans | 0.0 /100 | #313 | Tragic $34,942 |
| Apache | 0.0 /100 | #314 | Tragic $34,895 |
| Pennsylvania Germans | 0.0 /100 | #315 | Tragic $34,802 |