Paraguayan vs Immigrants from Eastern Europe Median Female Earnings
COMPARE
Paraguayan
Immigrants from Eastern Europe
Median Female Earnings
Median Female Earnings Comparison
Paraguayans
Immigrants from Eastern Europe
$43,173
MEDIAN FEMALE EARNINGS
99.9/ 100
METRIC RATING
58th/ 347
METRIC RANK
$43,309
MEDIAN FEMALE EARNINGS
99.9/ 100
METRIC RATING
53rd/ 347
METRIC RANK
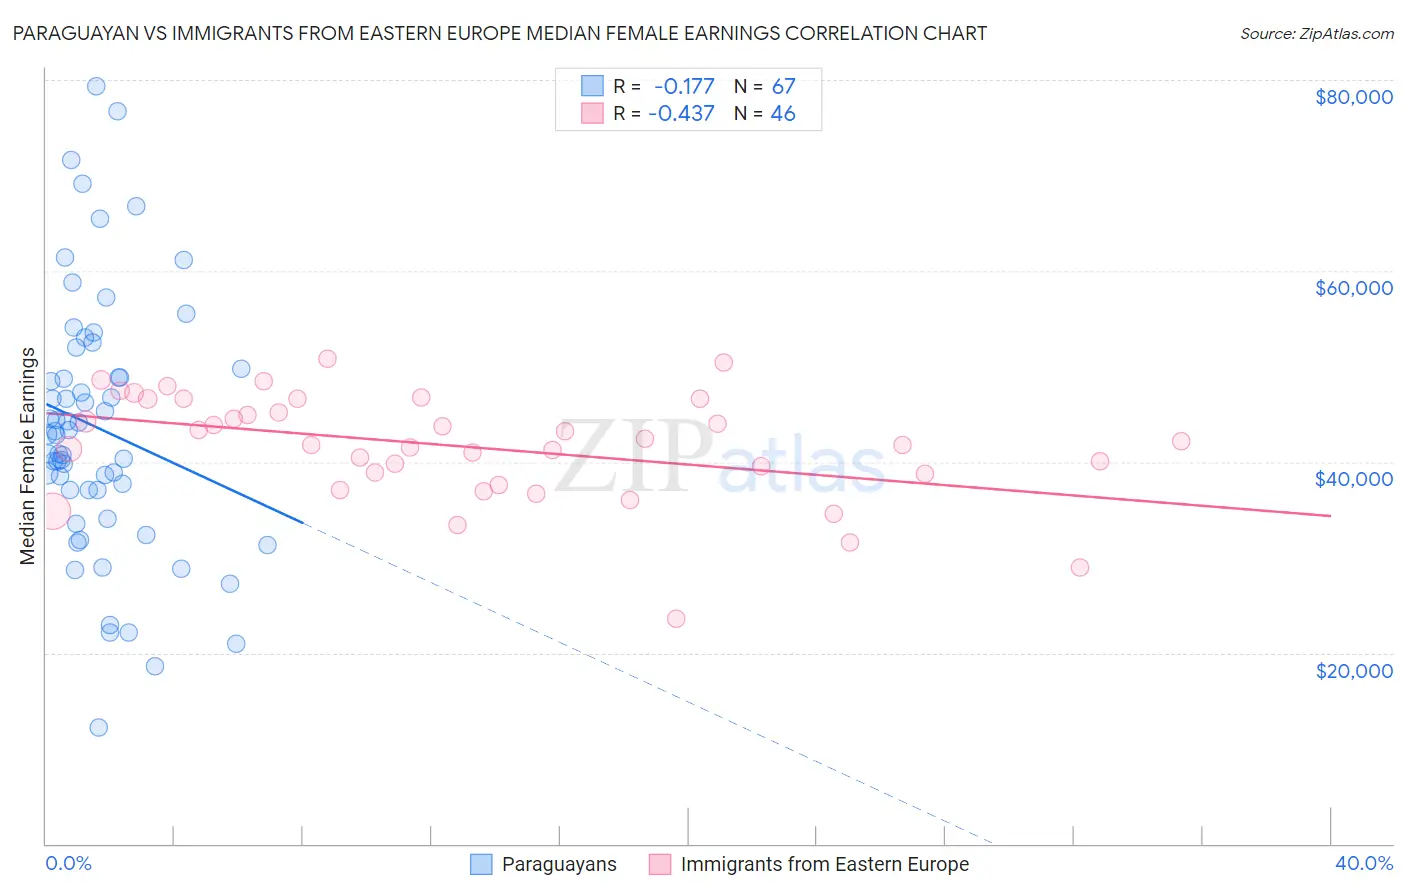
Paraguayan vs Immigrants from Eastern Europe Median Female Earnings Correlation Chart
The statistical analysis conducted on geographies consisting of 95,111,705 people shows a poor negative correlation between the proportion of Paraguayans and median female earnings in the United States with a correlation coefficient (R) of -0.177 and weighted average of $43,173. Similarly, the statistical analysis conducted on geographies consisting of 475,519,051 people shows a moderate negative correlation between the proportion of Immigrants from Eastern Europe and median female earnings in the United States with a correlation coefficient (R) of -0.437 and weighted average of $43,309, a difference of 0.31%.
Median Female Earnings Correlation Summary
| Measurement | Paraguayan | Immigrants from Eastern Europe |
| Minimum | $12,152 | $23,547 |
| Maximum | $79,410 | $50,763 |
| Range | $67,258 | $27,216 |
| Mean | $43,505 | $41,579 |
| Median | $42,896 | $41,989 |
| Interquartile 25% (IQ1) | $37,010 | $38,750 |
| Interquartile 75% (IQ3) | $49,789 | $46,583 |
| Interquartile Range (IQR) | $12,779 | $7,833 |
| Standard Deviation (Sample) | $13,576 | $5,669 |
| Standard Deviation (Population) | $13,475 | $5,607 |
Demographics Similar to Paraguayans and Immigrants from Eastern Europe by Median Female Earnings
In terms of median female earnings, the demographic groups most similar to Paraguayans are Ethiopian ($43,243, a difference of 0.16%), Estonian ($43,106, a difference of 0.16%), Immigrants from Latvia ($43,099, a difference of 0.17%), Immigrants from Croatia ($43,258, a difference of 0.20%), and Immigrants from Bulgaria ($43,085, a difference of 0.20%). Similarly, the demographic groups most similar to Immigrants from Eastern Europe are Australian ($43,308, a difference of 0.0%), Egyptian ($43,305, a difference of 0.010%), Immigrants from Lithuania ($43,317, a difference of 0.020%), Maltese ($43,357, a difference of 0.11%), and Immigrants from Uzbekistan ($43,363, a difference of 0.12%).
| Demographics | Rating | Rank | Median Female Earnings |
| Immigrants | Europe | 100.0 /100 | #45 | Exceptional $43,523 |
| Immigrants | Bolivia | 100.0 /100 | #46 | Exceptional $43,467 |
| Bolivians | 100.0 /100 | #47 | Exceptional $43,445 |
| Immigrants | Indonesia | 100.0 /100 | #48 | Exceptional $43,412 |
| Immigrants | Serbia | 100.0 /100 | #49 | Exceptional $43,385 |
| Immigrants | Uzbekistan | 100.0 /100 | #50 | Exceptional $43,363 |
| Maltese | 100.0 /100 | #51 | Exceptional $43,357 |
| Immigrants | Lithuania | 99.9 /100 | #52 | Exceptional $43,317 |
| Immigrants | Eastern Europe | 99.9 /100 | #53 | Exceptional $43,309 |
| Australians | 99.9 /100 | #54 | Exceptional $43,308 |
| Egyptians | 99.9 /100 | #55 | Exceptional $43,305 |
| Immigrants | Croatia | 99.9 /100 | #56 | Exceptional $43,258 |
| Ethiopians | 99.9 /100 | #57 | Exceptional $43,243 |
| Paraguayans | 99.9 /100 | #58 | Exceptional $43,173 |
| Estonians | 99.9 /100 | #59 | Exceptional $43,106 |
| Immigrants | Latvia | 99.9 /100 | #60 | Exceptional $43,099 |
| Immigrants | Bulgaria | 99.9 /100 | #61 | Exceptional $43,085 |
| Afghans | 99.9 /100 | #62 | Exceptional $43,077 |
| Immigrants | Ukraine | 99.9 /100 | #63 | Exceptional $43,069 |
| Immigrants | Pakistan | 99.9 /100 | #64 | Exceptional $43,052 |
| Sierra Leoneans | 99.9 /100 | #65 | Exceptional $42,868 |