Paraguayan vs Osage Male Unemployment
COMPARE
Paraguayan
Osage
Male Unemployment
Male Unemployment Comparison
Paraguayans
Osage
4.9%
MALE UNEMPLOYMENT
99.5/ 100
METRIC RATING
35th/ 347
METRIC RANK
5.3%
MALE UNEMPLOYMENT
42.5/ 100
METRIC RATING
178th/ 347
METRIC RANK
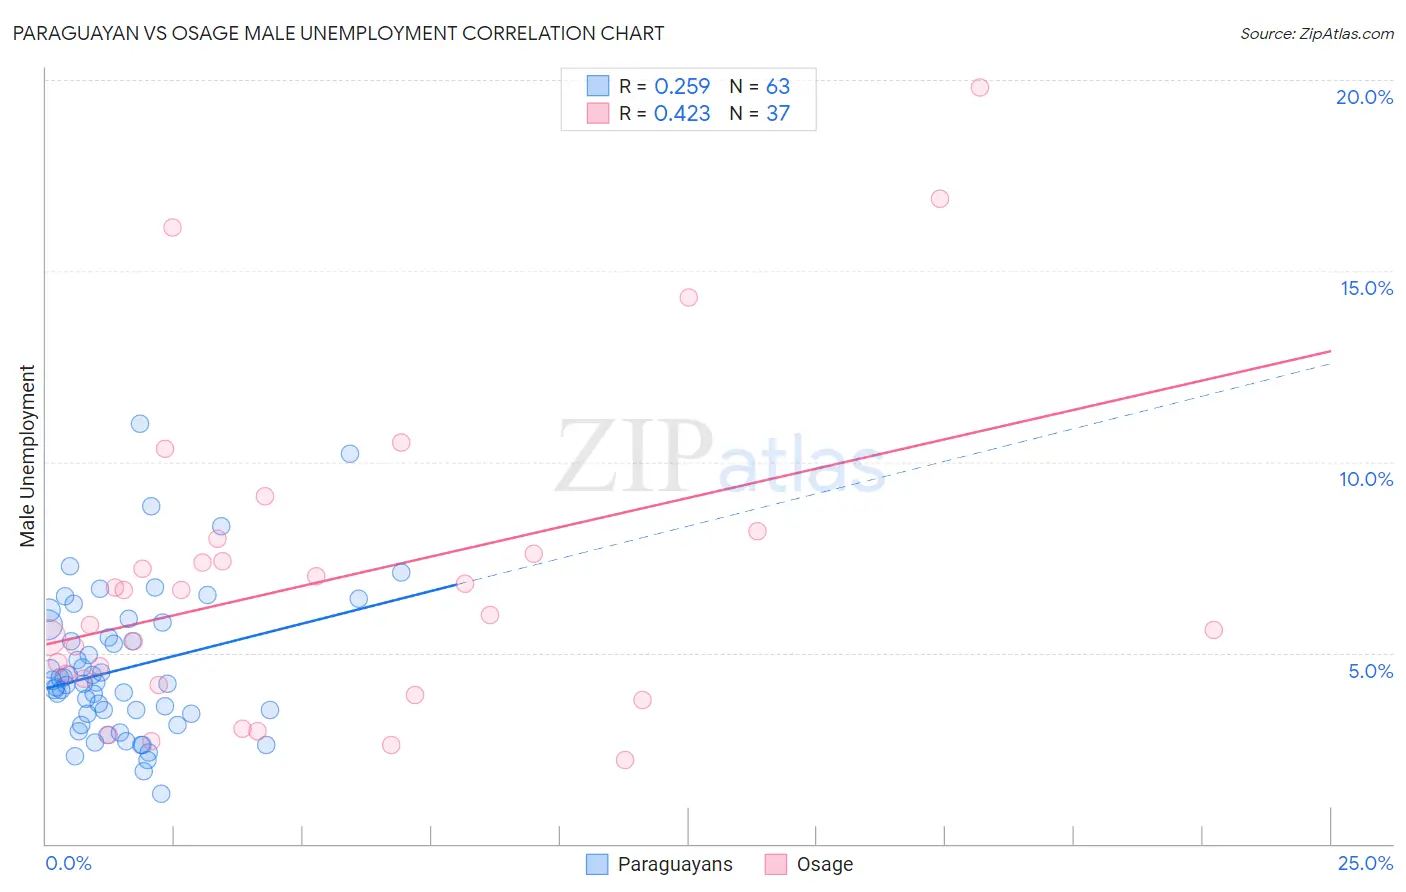
Paraguayan vs Osage Male Unemployment Correlation Chart
The statistical analysis conducted on geographies consisting of 95,072,234 people shows a weak positive correlation between the proportion of Paraguayans and unemployment rate among males in the United States with a correlation coefficient (R) of 0.259 and weighted average of 4.9%. Similarly, the statistical analysis conducted on geographies consisting of 91,677,196 people shows a moderate positive correlation between the proportion of Osage and unemployment rate among males in the United States with a correlation coefficient (R) of 0.423 and weighted average of 5.3%, a difference of 8.7%.
Male Unemployment Correlation Summary
| Measurement | Paraguayan | Osage |
| Minimum | 1.3% | 2.2% |
| Maximum | 11.0% | 19.8% |
| Range | 9.7% | 17.6% |
| Mean | 4.6% | 6.9% |
| Median | 4.2% | 6.0% |
| Interquartile 25% (IQ1) | 3.4% | 4.2% |
| Interquartile 75% (IQ3) | 5.7% | 7.8% |
| Interquartile Range (IQR) | 2.3% | 3.6% |
| Standard Deviation (Sample) | 1.9% | 4.1% |
| Standard Deviation (Population) | 1.9% | 4.0% |
Similar Demographics by Male Unemployment
Demographics Similar to Paraguayans by Male Unemployment
In terms of male unemployment, the demographic groups most similar to Paraguayans are Immigrants from Singapore (4.9%, a difference of 0.080%), Scotch-Irish (4.9%, a difference of 0.29%), Immigrants from Bosnia and Herzegovina (4.9%, a difference of 0.31%), Burmese (4.9%, a difference of 0.38%), and Northern European (4.9%, a difference of 0.46%).
| Demographics | Rating | Rank | Male Unemployment |
| Bulgarians | 99.8 /100 | #28 | Exceptional 4.8% |
| Scottish | 99.8 /100 | #29 | Exceptional 4.8% |
| British | 99.8 /100 | #30 | Exceptional 4.8% |
| Sudanese | 99.8 /100 | #31 | Exceptional 4.8% |
| Immigrants | Nepal | 99.8 /100 | #32 | Exceptional 4.8% |
| Latvians | 99.7 /100 | #33 | Exceptional 4.8% |
| Welsh | 99.7 /100 | #34 | Exceptional 4.8% |
| Paraguayans | 99.5 /100 | #35 | Exceptional 4.9% |
| Immigrants | Singapore | 99.4 /100 | #36 | Exceptional 4.9% |
| Scotch-Irish | 99.4 /100 | #37 | Exceptional 4.9% |
| Immigrants | Bosnia and Herzegovina | 99.4 /100 | #38 | Exceptional 4.9% |
| Burmese | 99.3 /100 | #39 | Exceptional 4.9% |
| Northern Europeans | 99.3 /100 | #40 | Exceptional 4.9% |
| Chinese | 99.3 /100 | #41 | Exceptional 4.9% |
| Immigrants | Belgium | 99.2 /100 | #42 | Exceptional 4.9% |
Demographics Similar to Osage by Male Unemployment
In terms of male unemployment, the demographic groups most similar to Osage are Immigrants from Oceania (5.3%, a difference of 0.10%), Immigrants from Peru (5.3%, a difference of 0.13%), Malaysian (5.3%, a difference of 0.17%), Immigrants from Poland (5.3%, a difference of 0.21%), and Immigrants from Afghanistan (5.3%, a difference of 0.28%).
| Demographics | Rating | Rank | Male Unemployment |
| Peruvians | 51.9 /100 | #171 | Average 5.3% |
| Immigrants | Kazakhstan | 50.8 /100 | #172 | Average 5.3% |
| Immigrants | Russia | 50.7 /100 | #173 | Average 5.3% |
| Immigrants | Iran | 50.0 /100 | #174 | Average 5.3% |
| Immigrants | Iraq | 48.1 /100 | #175 | Average 5.3% |
| Immigrants | Poland | 46.0 /100 | #176 | Average 5.3% |
| Immigrants | Peru | 44.6 /100 | #177 | Average 5.3% |
| Osage | 42.5 /100 | #178 | Average 5.3% |
| Immigrants | Oceania | 40.8 /100 | #179 | Average 5.3% |
| Malaysians | 39.6 /100 | #180 | Fair 5.3% |
| Immigrants | Afghanistan | 37.9 /100 | #181 | Fair 5.3% |
| Potawatomi | 37.8 /100 | #182 | Fair 5.3% |
| Taiwanese | 37.6 /100 | #183 | Fair 5.3% |
| Spaniards | 35.1 /100 | #184 | Fair 5.3% |
| Koreans | 34.9 /100 | #185 | Fair 5.3% |