Paraguayan vs Argentinean Median Female Earnings
COMPARE
Paraguayan
Argentinean
Median Female Earnings
Median Female Earnings Comparison
Paraguayans
Argentineans
$43,173
MEDIAN FEMALE EARNINGS
99.9/ 100
METRIC RATING
58th/ 347
METRIC RANK
$41,952
MEDIAN FEMALE EARNINGS
99.1/ 100
METRIC RATING
92nd/ 347
METRIC RANK
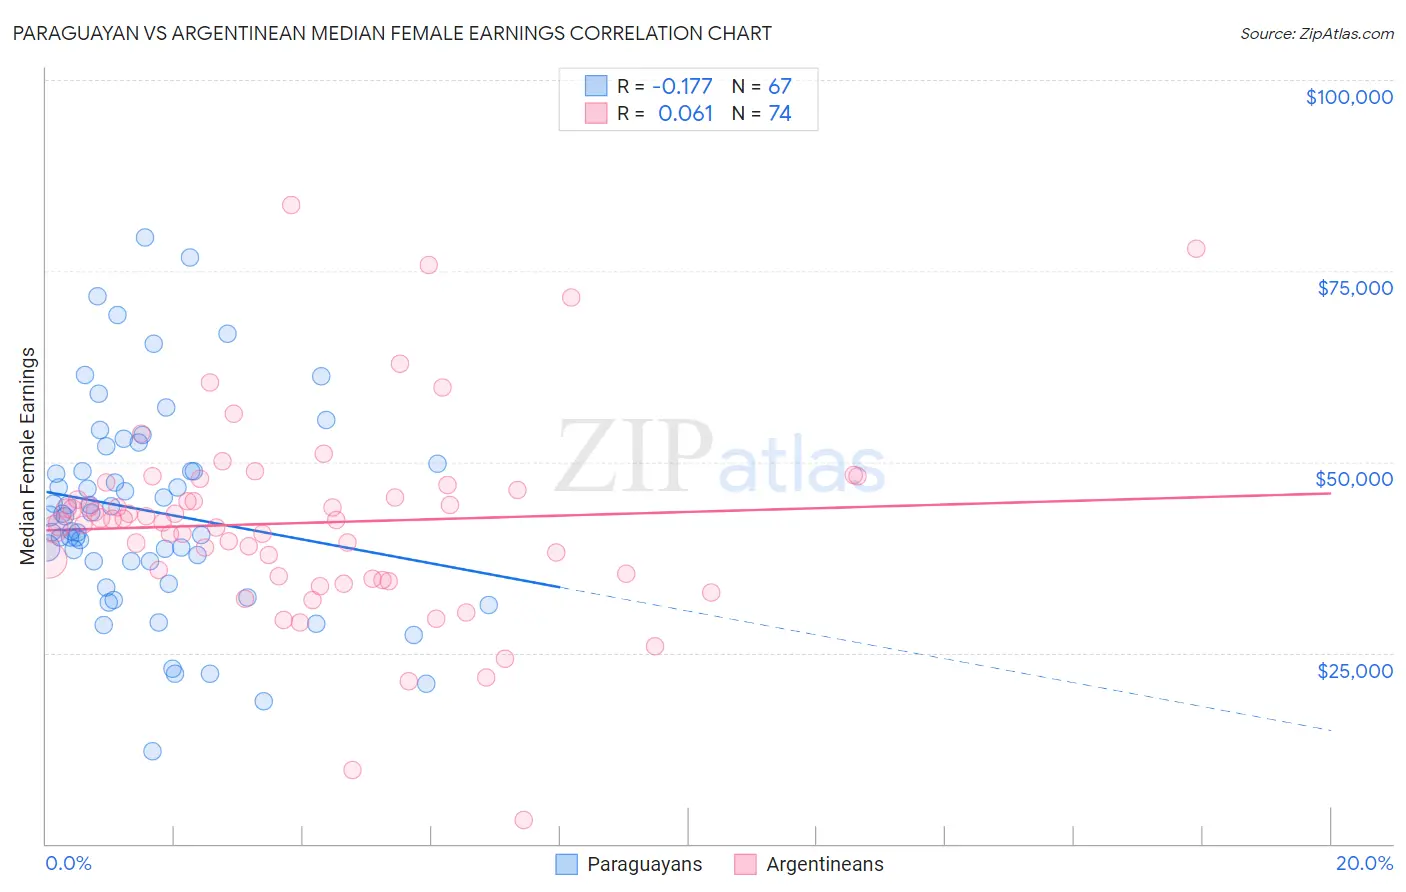
Paraguayan vs Argentinean Median Female Earnings Correlation Chart
The statistical analysis conducted on geographies consisting of 95,111,705 people shows a poor negative correlation between the proportion of Paraguayans and median female earnings in the United States with a correlation coefficient (R) of -0.177 and weighted average of $43,173. Similarly, the statistical analysis conducted on geographies consisting of 297,092,103 people shows a slight positive correlation between the proportion of Argentineans and median female earnings in the United States with a correlation coefficient (R) of 0.061 and weighted average of $41,952, a difference of 2.9%.
Median Female Earnings Correlation Summary
| Measurement | Paraguayan | Argentinean |
| Minimum | $12,152 | $3,125 |
| Maximum | $79,410 | $83,609 |
| Range | $67,258 | $80,484 |
| Mean | $43,505 | $42,021 |
| Median | $42,896 | $42,177 |
| Interquartile 25% (IQ1) | $37,010 | $34,978 |
| Interquartile 75% (IQ3) | $49,789 | $46,250 |
| Interquartile Range (IQR) | $12,779 | $11,272 |
| Standard Deviation (Sample) | $13,576 | $13,019 |
| Standard Deviation (Population) | $13,475 | $12,930 |
Similar Demographics by Median Female Earnings
Demographics Similar to Paraguayans by Median Female Earnings
In terms of median female earnings, the demographic groups most similar to Paraguayans are Ethiopian ($43,243, a difference of 0.16%), Estonian ($43,106, a difference of 0.16%), Immigrants from Latvia ($43,099, a difference of 0.17%), Immigrants from Croatia ($43,258, a difference of 0.20%), and Immigrants from Bulgaria ($43,085, a difference of 0.20%).
| Demographics | Rating | Rank | Median Female Earnings |
| Maltese | 100.0 /100 | #51 | Exceptional $43,357 |
| Immigrants | Lithuania | 99.9 /100 | #52 | Exceptional $43,317 |
| Immigrants | Eastern Europe | 99.9 /100 | #53 | Exceptional $43,309 |
| Australians | 99.9 /100 | #54 | Exceptional $43,308 |
| Egyptians | 99.9 /100 | #55 | Exceptional $43,305 |
| Immigrants | Croatia | 99.9 /100 | #56 | Exceptional $43,258 |
| Ethiopians | 99.9 /100 | #57 | Exceptional $43,243 |
| Paraguayans | 99.9 /100 | #58 | Exceptional $43,173 |
| Estonians | 99.9 /100 | #59 | Exceptional $43,106 |
| Immigrants | Latvia | 99.9 /100 | #60 | Exceptional $43,099 |
| Immigrants | Bulgaria | 99.9 /100 | #61 | Exceptional $43,085 |
| Afghans | 99.9 /100 | #62 | Exceptional $43,077 |
| Immigrants | Ukraine | 99.9 /100 | #63 | Exceptional $43,069 |
| Immigrants | Pakistan | 99.9 /100 | #64 | Exceptional $43,052 |
| Sierra Leoneans | 99.9 /100 | #65 | Exceptional $42,868 |
Demographics Similar to Argentineans by Median Female Earnings
In terms of median female earnings, the demographic groups most similar to Argentineans are Immigrants from Grenada ($41,932, a difference of 0.050%), Immigrants from Western Europe ($41,990, a difference of 0.090%), Ukrainian ($42,015, a difference of 0.15%), Moroccan ($41,872, a difference of 0.19%), and Immigrants from Netherlands ($41,870, a difference of 0.20%).
| Demographics | Rating | Rank | Median Female Earnings |
| Laotians | 99.4 /100 | #85 | Exceptional $42,133 |
| Immigrants | St. Vincent and the Grenadines | 99.3 /100 | #86 | Exceptional $42,108 |
| Lithuanians | 99.3 /100 | #87 | Exceptional $42,108 |
| Immigrants | Northern Africa | 99.3 /100 | #88 | Exceptional $42,084 |
| Immigrants | Afghanistan | 99.3 /100 | #89 | Exceptional $42,055 |
| Ukrainians | 99.2 /100 | #90 | Exceptional $42,015 |
| Immigrants | Western Europe | 99.2 /100 | #91 | Exceptional $41,990 |
| Argentineans | 99.1 /100 | #92 | Exceptional $41,952 |
| Immigrants | Grenada | 99.0 /100 | #93 | Exceptional $41,932 |
| Moroccans | 98.9 /100 | #94 | Exceptional $41,872 |
| Immigrants | Netherlands | 98.9 /100 | #95 | Exceptional $41,870 |
| South Africans | 98.8 /100 | #96 | Exceptional $41,825 |
| Immigrants | Hungary | 98.8 /100 | #97 | Exceptional $41,820 |
| Immigrants | Scotland | 98.7 /100 | #98 | Exceptional $41,771 |
| Immigrants | Barbados | 98.4 /100 | #99 | Exceptional $41,685 |