Paraguayan vs Osage Unemployment
COMPARE
Paraguayan
Osage
Unemployment
Unemployment Comparison
Paraguayans
Osage
4.9%
UNEMPLOYMENT
98.3/ 100
METRIC RATING
73rd/ 347
METRIC RANK
5.0%
UNEMPLOYMENT
94.0/ 100
METRIC RATING
104th/ 347
METRIC RANK
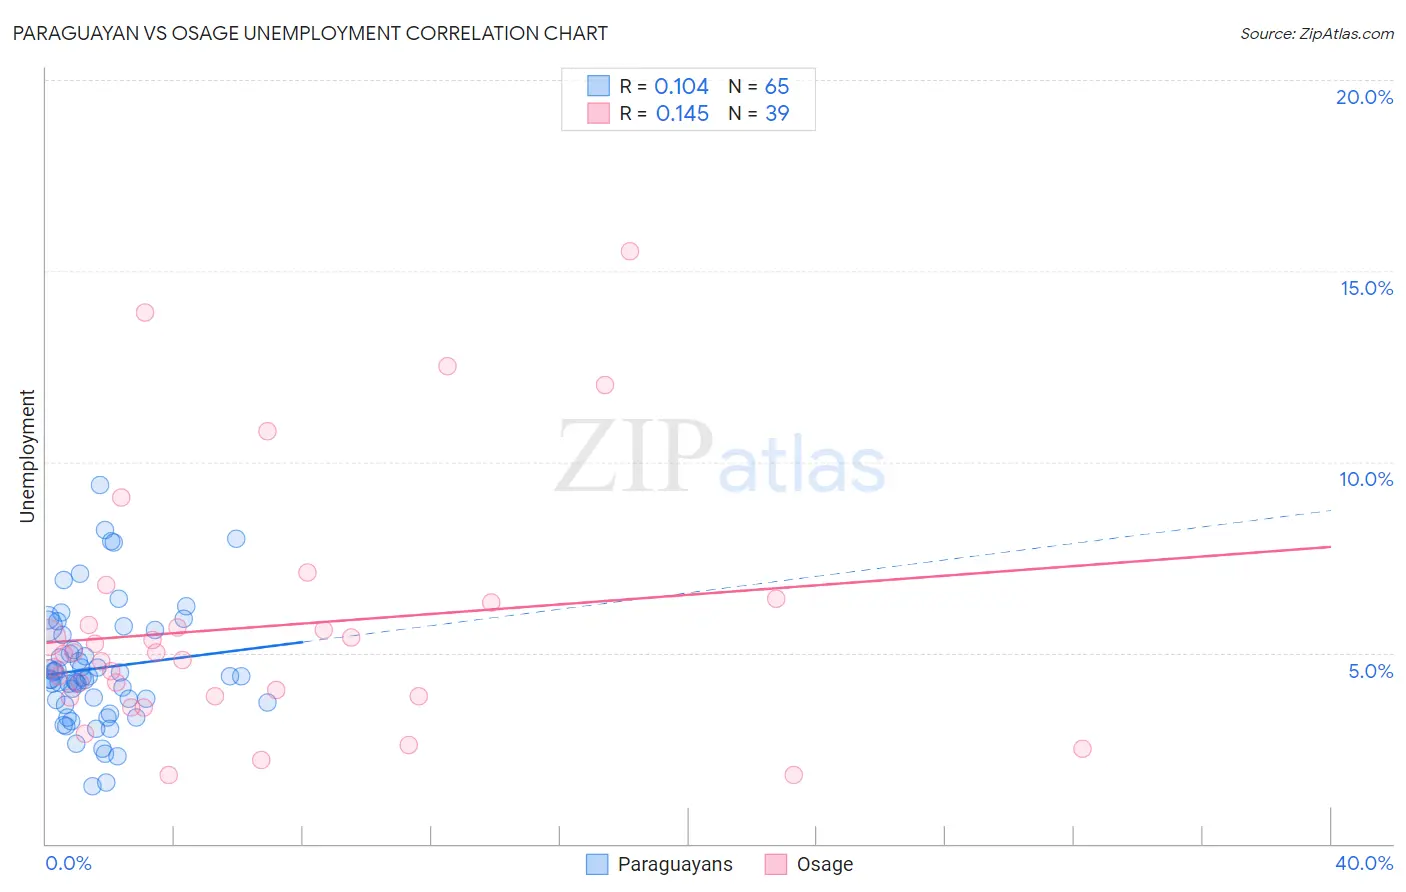
Paraguayan vs Osage Unemployment Correlation Chart
The statistical analysis conducted on geographies consisting of 95,099,776 people shows a poor positive correlation between the proportion of Paraguayans and unemployment in the United States with a correlation coefficient (R) of 0.104 and weighted average of 4.9%. Similarly, the statistical analysis conducted on geographies consisting of 91,752,041 people shows a poor positive correlation between the proportion of Osage and unemployment in the United States with a correlation coefficient (R) of 0.145 and weighted average of 5.0%, a difference of 2.1%.
Unemployment Correlation Summary
| Measurement | Paraguayan | Osage |
| Minimum | 1.5% | 1.8% |
| Maximum | 9.4% | 15.5% |
| Range | 7.9% | 13.7% |
| Mean | 4.6% | 5.7% |
| Median | 4.4% | 5.0% |
| Interquartile 25% (IQ1) | 3.7% | 3.9% |
| Interquartile 75% (IQ3) | 5.5% | 6.3% |
| Interquartile Range (IQR) | 1.9% | 2.5% |
| Standard Deviation (Sample) | 1.6% | 3.2% |
| Standard Deviation (Population) | 1.6% | 3.2% |
Similar Demographics by Unemployment
Demographics Similar to Paraguayans by Unemployment
In terms of unemployment, the demographic groups most similar to Paraguayans are Burmese (4.9%, a difference of 0.040%), Immigrants from Japan (4.9%, a difference of 0.070%), Immigrants from Northern Europe (4.9%, a difference of 0.090%), Serbian (4.9%, a difference of 0.12%), and Turkish (4.9%, a difference of 0.23%).
| Demographics | Rating | Rank | Unemployment |
| Slovaks | 98.7 /100 | #66 | Exceptional 4.9% |
| New Zealanders | 98.6 /100 | #67 | Exceptional 4.9% |
| Slavs | 98.6 /100 | #68 | Exceptional 4.9% |
| Immigrants | North America | 98.5 /100 | #69 | Exceptional 4.9% |
| Serbians | 98.4 /100 | #70 | Exceptional 4.9% |
| Immigrants | Japan | 98.3 /100 | #71 | Exceptional 4.9% |
| Burmese | 98.3 /100 | #72 | Exceptional 4.9% |
| Paraguayans | 98.3 /100 | #73 | Exceptional 4.9% |
| Immigrants | Northern Europe | 98.2 /100 | #74 | Exceptional 4.9% |
| Turks | 98.0 /100 | #75 | Exceptional 4.9% |
| German Russians | 98.0 /100 | #76 | Exceptional 4.9% |
| Cypriots | 97.9 /100 | #77 | Exceptional 4.9% |
| Okinawans | 97.9 /100 | #78 | Exceptional 4.9% |
| Canadians | 97.7 /100 | #79 | Exceptional 5.0% |
| Immigrants | Sweden | 97.6 /100 | #80 | Exceptional 5.0% |
Demographics Similar to Osage by Unemployment
In terms of unemployment, the demographic groups most similar to Osage are Chickasaw (5.0%, a difference of 0.0%), Maltese (5.0%, a difference of 0.0%), Immigrants from Argentina (5.0%, a difference of 0.040%), Immigrants from Romania (5.0%, a difference of 0.070%), and American (5.0%, a difference of 0.080%).
| Demographics | Rating | Rank | Unemployment |
| Immigrants | Czechoslovakia | 95.1 /100 | #97 | Exceptional 5.0% |
| Romanians | 95.0 /100 | #98 | Exceptional 5.0% |
| Mongolians | 94.8 /100 | #99 | Exceptional 5.0% |
| Estonians | 94.6 /100 | #100 | Exceptional 5.0% |
| Americans | 94.3 /100 | #101 | Exceptional 5.0% |
| Immigrants | Argentina | 94.1 /100 | #102 | Exceptional 5.0% |
| Chickasaw | 94.0 /100 | #103 | Exceptional 5.0% |
| Osage | 94.0 /100 | #104 | Exceptional 5.0% |
| Maltese | 94.0 /100 | #105 | Exceptional 5.0% |
| Immigrants | Romania | 93.7 /100 | #106 | Exceptional 5.0% |
| Immigrants | Turkey | 93.7 /100 | #107 | Exceptional 5.0% |
| Immigrants | Kuwait | 93.7 /100 | #108 | Exceptional 5.0% |
| Immigrants | Eritrea | 93.3 /100 | #109 | Exceptional 5.0% |
| Immigrants | Lithuania | 93.2 /100 | #110 | Exceptional 5.0% |
| Chileans | 93.2 /100 | #111 | Exceptional 5.0% |