Paraguayan vs Norwegian Median Female Earnings
COMPARE
Paraguayan
Norwegian
Median Female Earnings
Median Female Earnings Comparison
Paraguayans
Norwegians
$43,173
MEDIAN FEMALE EARNINGS
99.9/ 100
METRIC RATING
58th/ 347
METRIC RANK
$38,802
MEDIAN FEMALE EARNINGS
13.4/ 100
METRIC RATING
209th/ 347
METRIC RANK
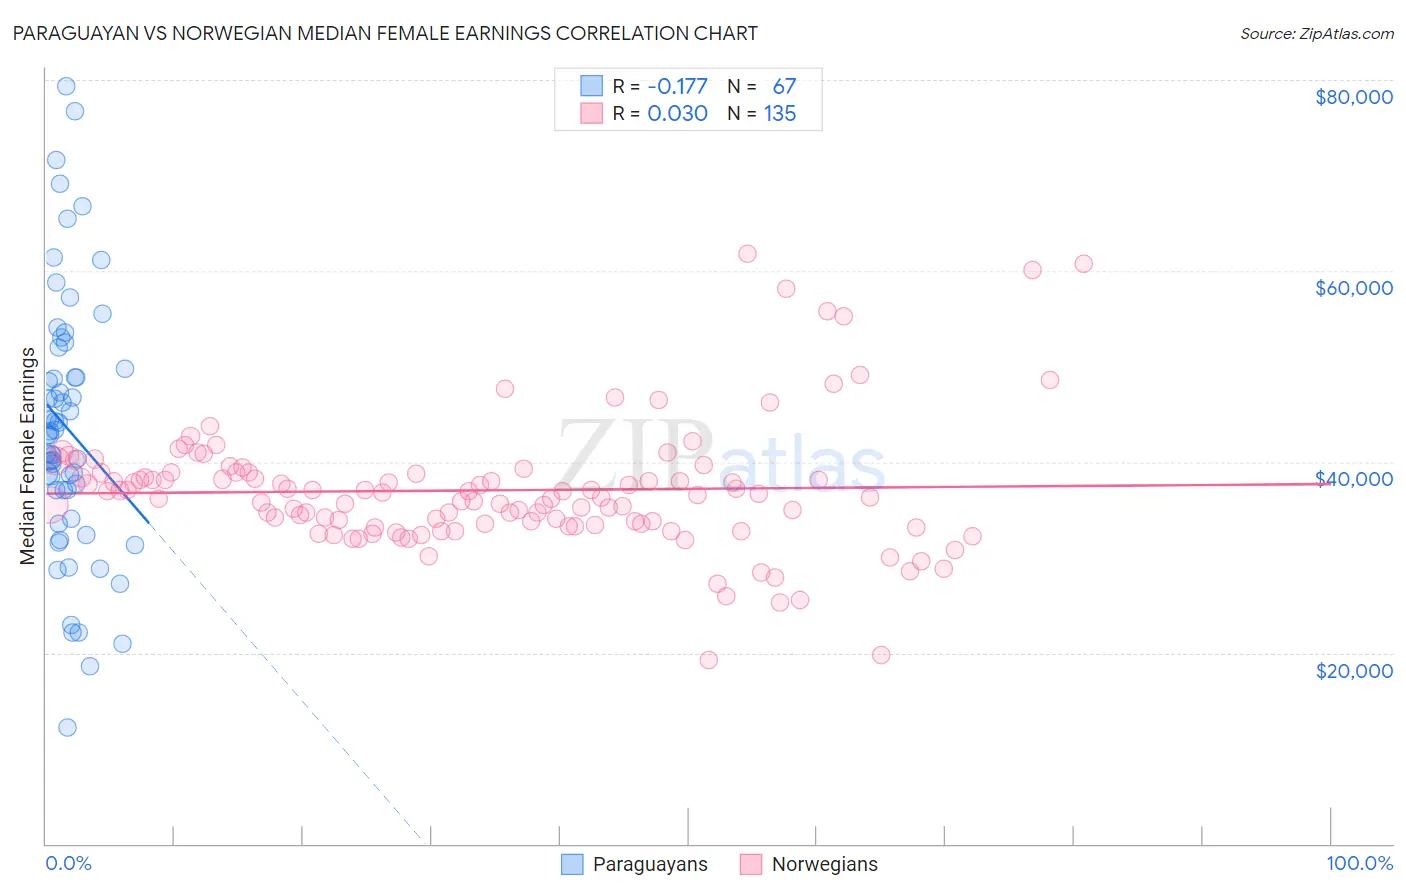
Paraguayan vs Norwegian Median Female Earnings Correlation Chart
The statistical analysis conducted on geographies consisting of 95,111,705 people shows a poor negative correlation between the proportion of Paraguayans and median female earnings in the United States with a correlation coefficient (R) of -0.177 and weighted average of $43,173. Similarly, the statistical analysis conducted on geographies consisting of 532,275,567 people shows no correlation between the proportion of Norwegians and median female earnings in the United States with a correlation coefficient (R) of 0.030 and weighted average of $38,802, a difference of 11.3%.
Median Female Earnings Correlation Summary
| Measurement | Paraguayan | Norwegian |
| Minimum | $12,152 | $19,310 |
| Maximum | $79,410 | $61,750 |
| Range | $67,258 | $42,440 |
| Mean | $43,505 | $37,022 |
| Median | $42,896 | $36,510 |
| Interquartile 25% (IQ1) | $37,010 | $33,325 |
| Interquartile 75% (IQ3) | $49,789 | $38,843 |
| Interquartile Range (IQR) | $12,779 | $5,519 |
| Standard Deviation (Sample) | $13,576 | $6,760 |
| Standard Deviation (Population) | $13,475 | $6,735 |
Similar Demographics by Median Female Earnings
Demographics Similar to Paraguayans by Median Female Earnings
In terms of median female earnings, the demographic groups most similar to Paraguayans are Ethiopian ($43,243, a difference of 0.16%), Estonian ($43,106, a difference of 0.16%), Immigrants from Latvia ($43,099, a difference of 0.17%), Immigrants from Croatia ($43,258, a difference of 0.20%), and Immigrants from Bulgaria ($43,085, a difference of 0.20%).
| Demographics | Rating | Rank | Median Female Earnings |
| Maltese | 100.0 /100 | #51 | Exceptional $43,357 |
| Immigrants | Lithuania | 99.9 /100 | #52 | Exceptional $43,317 |
| Immigrants | Eastern Europe | 99.9 /100 | #53 | Exceptional $43,309 |
| Australians | 99.9 /100 | #54 | Exceptional $43,308 |
| Egyptians | 99.9 /100 | #55 | Exceptional $43,305 |
| Immigrants | Croatia | 99.9 /100 | #56 | Exceptional $43,258 |
| Ethiopians | 99.9 /100 | #57 | Exceptional $43,243 |
| Paraguayans | 99.9 /100 | #58 | Exceptional $43,173 |
| Estonians | 99.9 /100 | #59 | Exceptional $43,106 |
| Immigrants | Latvia | 99.9 /100 | #60 | Exceptional $43,099 |
| Immigrants | Bulgaria | 99.9 /100 | #61 | Exceptional $43,085 |
| Afghans | 99.9 /100 | #62 | Exceptional $43,077 |
| Immigrants | Ukraine | 99.9 /100 | #63 | Exceptional $43,069 |
| Immigrants | Pakistan | 99.9 /100 | #64 | Exceptional $43,052 |
| Sierra Leoneans | 99.9 /100 | #65 | Exceptional $42,868 |
Demographics Similar to Norwegians by Median Female Earnings
In terms of median female earnings, the demographic groups most similar to Norwegians are Immigrants from Thailand ($38,810, a difference of 0.020%), Immigrants from Cambodia ($38,833, a difference of 0.080%), Czechoslovakian ($38,738, a difference of 0.17%), Aleut ($38,719, a difference of 0.21%), and Immigrants from Bosnia and Herzegovina ($38,886, a difference of 0.22%).
| Demographics | Rating | Rank | Median Female Earnings |
| Slovaks | 19.9 /100 | #202 | Poor $39,029 |
| Czechs | 18.7 /100 | #203 | Poor $38,992 |
| Immigrants | Uruguay | 17.3 /100 | #204 | Poor $38,945 |
| Immigrants | Colombia | 16.3 /100 | #205 | Poor $38,913 |
| Immigrants | Bosnia and Herzegovina | 15.6 /100 | #206 | Poor $38,886 |
| Immigrants | Cambodia | 14.2 /100 | #207 | Poor $38,833 |
| Immigrants | Thailand | 13.6 /100 | #208 | Poor $38,810 |
| Norwegians | 13.4 /100 | #209 | Poor $38,802 |
| Czechoslovakians | 12.0 /100 | #210 | Poor $38,738 |
| Aleuts | 11.6 /100 | #211 | Poor $38,719 |
| Guamanians/Chamorros | 11.5 /100 | #212 | Poor $38,717 |
| Jamaicans | 10.5 /100 | #213 | Poor $38,670 |
| Iraqis | 10.5 /100 | #214 | Poor $38,666 |
| Spaniards | 10.3 /100 | #215 | Poor $38,656 |
| Immigrants | Ecuador | 10.1 /100 | #216 | Poor $38,644 |