Paraguayan vs Immigrants from Iran Median Female Earnings

COMPARE

Paraguayan
Race
Ancestry
AfghanAfricanAlaska NativeAlaskan AthabascanAlbanianAleutAlsatianAmericanApacheArabArapahoArgentineanArmenianAssyrian/Chaldean/SyriacAustralianAustrianBahamianBangladeshiBarbadianBasqueBelgianBelizeanBermudanBhutaneseBlackfeetBolivianBrazilianBritishBritish West IndianBulgarianBurmeseCajunCambodianCanadianCape VerdeanCarpatho RusynCelticCentral AmericanCentral American IndianCherokeeCheyenneChickasawChileanChineseChippewaChoctawColombianColvilleComancheCosta RicanCreeCreekCroatianCrowCubanCypriotCzechCzechoslovakianDanishDelawareDominicanDutchDutch West IndianEastern EuropeanEcuadorianEgyptianEnglishEstonianEthiopianEuropeanFijianFilipinoFinnishFrenchFrench American IndianFrench CanadianGermanGerman RussianGhanaianGreekGuamanian/ChamorroGuatemalanGuyaneseHaitianHmongHonduranHopiHoumaHungarianIcelanderIndian (Asian)IndonesianInupiatIranianIraqiIrishIroquoisIsraeliItalianJamaicanJapaneseJordanianKenyanKiowaKoreanLaotianLatvianLebaneseLiberianLithuanianLumbeeLuxembourgerMacedonianMalaysianMalteseMarshalleseMenomineeMexicanMexican American IndianMongolianMoroccanNative HawaiianNavajoNepaleseNew ZealanderNicaraguanNigerianNorthern EuropeanNorwegianOkinawanOsageOttawaPaiutePakistaniPalestinianPanamanianParaguayanPennsylvania GermanPeruvianPimaPolishPortuguesePotawatomiPuebloPuerto RicanPuget Sound SalishRomanianRussianSalvadoranSamoanScandinavianScotch-IrishScottishSeminoleSenegaleseSerbianShoshoneSierra LeoneanSiouxSlavicSlovakSloveneSomaliSouth AfricanSouth AmericanSouth American IndianSoviet UnionSpaniardSpanishSpanish AmericanSpanish American IndianSri LankanSubsaharan AfricanSudaneseSwedishSwissSyrianTaiwaneseThaiTlingit-HaidaTohono O'OdhamTonganTrinidadian and TobagonianTsimshianTurkishU.S. Virgin IslanderUgandanUkrainianUruguayanUteVenezuelanVietnameseWelshWest IndianYakamaYaquiYugoslavianYumanYup'ikZimbabwean
Immigration
NonimmigrantsImmigrantsAfghanistanAfricaAlbaniaArgentinaArmeniaAsiaAustraliaAustriaBahamasBangladeshBarbadosBelarusBelgiumBelizeBoliviaBosnia and HerzegovinaBrazilBulgariaBurma/MyanmarCabo VerdeCambodiaCameroonCanadaCaribbeanCentral AmericaChileChinaColombiaCongoCosta RicaCroatiaCubaCzechoslovakiaDenmarkDominicaDominican RepublicEastern AfricaEastern AsiaEastern EuropeEcuadorEgyptEl SalvadorEnglandEritreaEthiopiaEuropeFijiFranceGermanyGhanaGreeceGrenadaGuatemalaGuyanaHaitiHondurasHong KongHungaryIndiaIndonesiaIraqIrelandIsraelItalyJamaicaJapanJordanKazakhstanKenyaKoreaKuwaitLaosLatin AmericaLatviaLebanonLiberiaLithuaniaMalaysiaMexicoMicronesiaMiddle AfricaMoldovaMoroccoNepalNetherlandsNicaraguaNigeriaNorth AmericaNorth MacedoniaNorthern AfricaNorthern EuropeNorwayOceaniaPakistanPanamaPeruPhilippinesPolandPortugalRomaniaRussiaSaudi ArabiaScotlandSenegalSerbiaSierra LeoneSingaporeSomaliaSouth AfricaSouth AmericaSouth Central AsiaSouth Eastern AsiaSouthern EuropeSpainSri LankaSt. Vincent and the GrenadinesSudanSwedenSwitzerlandSyriaTaiwanThailandTrinidad and TobagoTurkeyUgandaUkraineUruguayUzbekistanVenezuelaVietnamWest IndiesWestern AfricaWestern AsiaWestern EuropeYemenZaireZimbabweAzores
Immigrants from Iran
Race
Ancestry
AfghanAfricanAlaska NativeAlaskan AthabascanAlbanianAleutAlsatianAmericanApacheArabArapahoArgentineanArmenianAssyrian/Chaldean/SyriacAustralianAustrianBahamianBangladeshiBarbadianBasqueBelgianBelizeanBermudanBhutaneseBlackfeetBolivianBrazilianBritishBritish West IndianBulgarianBurmeseCajunCambodianCanadianCape VerdeanCarpatho RusynCelticCentral AmericanCentral American IndianCherokeeCheyenneChickasawChileanChineseChippewaChoctawColombianColvilleComancheCosta RicanCreeCreekCroatianCrowCubanCypriotCzechCzechoslovakianDanishDelawareDominicanDutchDutch West IndianEastern EuropeanEcuadorianEgyptianEnglishEstonianEthiopianEuropeanFijianFilipinoFinnishFrenchFrench American IndianFrench CanadianGermanGerman RussianGhanaianGreekGuamanian/ChamorroGuatemalanGuyaneseHaitianHmongHonduranHopiHoumaHungarianIcelanderIndian (Asian)IndonesianInupiatIranianIraqiIrishIroquoisIsraeliItalianJamaicanJapaneseJordanianKenyanKiowaKoreanLaotianLatvianLebaneseLiberianLithuanianLumbeeLuxembourgerMacedonianMalaysianMalteseMarshalleseMenomineeMexicanMexican American IndianMongolianMoroccanNative HawaiianNavajoNepaleseNew ZealanderNicaraguanNigerianNorthern EuropeanNorwegianOkinawanOsageOttawaPaiutePakistaniPalestinianPanamanianPennsylvania GermanPeruvianPimaPolishPortuguesePotawatomiPuebloPuerto RicanPuget Sound SalishRomanianRussianSalvadoranSamoanScandinavianScotch-IrishScottishSeminoleSenegaleseSerbianShoshoneSierra LeoneanSiouxSlavicSlovakSloveneSomaliSouth AfricanSouth AmericanSouth American IndianSoviet UnionSpaniardSpanishSpanish AmericanSpanish American IndianSri LankanSubsaharan AfricanSudaneseSwedishSwissSyrianTaiwaneseThaiTlingit-HaidaTohono O'OdhamTonganTrinidadian and TobagonianTsimshianTurkishU.S. Virgin IslanderUgandanUkrainianUruguayanUteVenezuelanVietnameseWelshWest IndianYakamaYaquiYugoslavianYumanYup'ikZimbabwean
Immigration
NonimmigrantsImmigrantsAfghanistanAfricaAlbaniaArgentinaArmeniaAsiaAustraliaAustriaBahamasBangladeshBarbadosBelarusBelgiumBelizeBoliviaBosnia and HerzegovinaBrazilBulgariaBurma/MyanmarCabo VerdeCambodiaCameroonCanadaCaribbeanCentral AmericaChileChinaColombiaCongoCosta RicaCroatiaCubaCzechoslovakiaDenmarkDominicaDominican RepublicEastern AfricaEastern AsiaEastern EuropeEcuadorEgyptEl SalvadorEnglandEritreaEthiopiaEuropeFijiFranceGermanyGhanaGreeceGrenadaGuatemalaGuyanaHaitiHondurasHong KongHungaryIndiaIndonesiaIranIraqIrelandIsraelItalyJamaicaJapanJordanKazakhstanKenyaKoreaKuwaitLaosLatin AmericaLatviaLebanonLiberiaLithuaniaMalaysiaMexicoMicronesiaMiddle AfricaMoldovaMoroccoNepalNetherlandsNicaraguaNigeriaNorth AmericaNorth MacedoniaNorthern AfricaNorthern EuropeNorwayOceaniaPakistanPanamaPeruPhilippinesPolandPortugalRomaniaRussiaSaudi ArabiaScotlandSenegalSerbiaSierra LeoneSingaporeSomaliaSouth AfricaSouth AmericaSouth Central AsiaSouth Eastern AsiaSouthern EuropeSpainSri LankaSt. Vincent and the GrenadinesSudanSwedenSwitzerlandSyriaTaiwanThailandTrinidad and TobagoTurkeyUgandaUkraineUruguayUzbekistanVenezuelaVietnamWest IndiesWestern AfricaWestern AsiaWestern EuropeYemenZaireZimbabweAzores
Median Female Earnings
Income
Poverty
Unemployment
Labor Participation
Family Structure
Vehicle Availability
Education Level
Disability

Median Female Earnings Comparison

Paraguayans

Immigrants from Iran

Exceptional
Exceptional
$43,173
MEDIAN FEMALE EARNINGS
99.9/ 100
METRIC RATING
58th/ 347
METRIC RANK
$47,154
MEDIAN FEMALE EARNINGS
100.0/ 100
METRIC RATING
9th/ 347
METRIC RANK

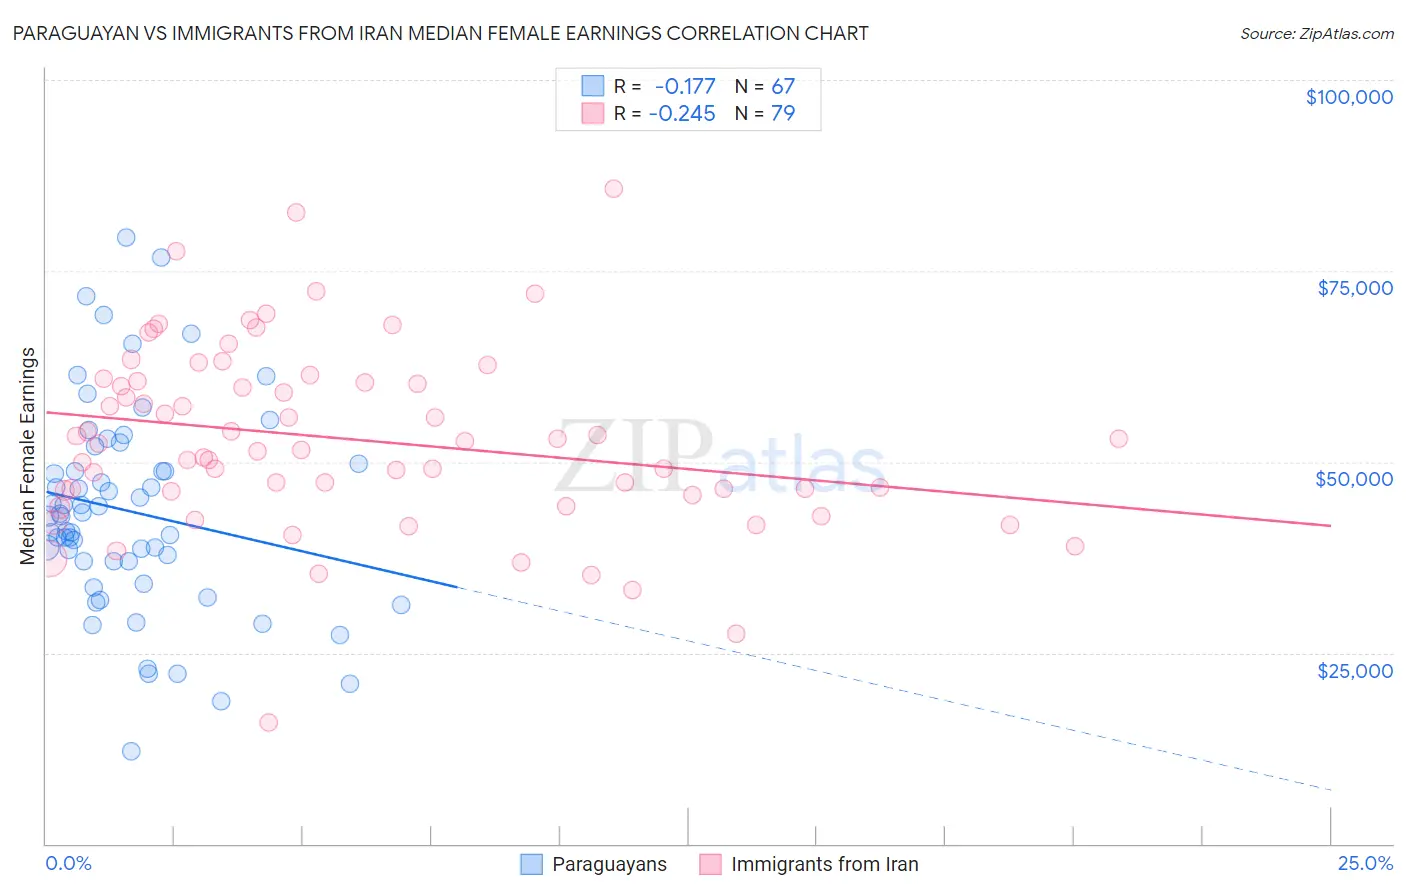
Paraguayan vs Immigrants from Iran Median Female Earnings Correlation Chart

The statistical analysis conducted on geographies consisting of 95,111,705 people shows a poor negative correlation between the proportion of Paraguayans and median female earnings in the United States with a correlation coefficient (R) of -0.177 and weighted average of $43,173. Similarly, the statistical analysis conducted on geographies consisting of 279,791,483 people shows a weak negative correlation between the proportion of Immigrants from Iran and median female earnings in the United States with a correlation coefficient (R) of -0.245 and weighted average of $47,154, a difference of 9.2%.
Paraguayan vs Immigrants from Iran Median Female Earnings

Median Female Earnings Correlation Summary

MeasurementParaguayanImmigrants from Iran
Minimum$12,152$15,864
Maximum$79,410$85,822
Range$67,258$69,958
Mean$43,505$52,976
Median$42,896$52,367
Interquartile 25% (IQ1)$37,010$46,131
Interquartile 75% (IQ3)$49,789$60,507
Interquartile Range (IQR)$12,779$14,376
Standard Deviation (Sample)$13,576$12,151
Standard Deviation (Population)$13,475$12,074

Similar Demographics by Median Female Earnings

Demographics Similar to Paraguayans by Median Female Earnings

In terms of median female earnings, the demographic groups most similar to Paraguayans are Ethiopian ($43,243, a difference of 0.16%), Estonian ($43,106, a difference of 0.16%), Immigrants from Latvia ($43,099, a difference of 0.17%), Immigrants from Croatia ($43,258, a difference of 0.20%), and Immigrants from Bulgaria ($43,085, a difference of 0.20%).
DemographicsRating | RankMedian Female Earnings
Maltese
100.0
/100
|
#51
Exceptional
$43,357
Immigrants | Lithuania
99.9
/100
|
#52
Exceptional
$43,317
Immigrants | Eastern Europe
99.9
/100
|
#53
Exceptional
$43,309
Australians
99.9
/100
|
#54
Exceptional
$43,308
Egyptians
99.9
/100
|
#55
Exceptional
$43,305
Immigrants | Croatia
99.9
/100
|
#56
Exceptional
$43,258
Ethiopians
99.9
/100
|
#57
Exceptional
$43,243
Paraguayans
99.9
/100
|
#58
Exceptional
$43,173
Estonians
99.9
/100
|
#59
Exceptional
$43,106
Immigrants | Latvia
99.9
/100
|
#60
Exceptional
$43,099
Immigrants | Bulgaria
99.9
/100
|
#61
Exceptional
$43,085
Afghans
99.9
/100
|
#62
Exceptional
$43,077
Immigrants | Ukraine
99.9
/100
|
#63
Exceptional
$43,069
Immigrants | Pakistan
99.9
/100
|
#64
Exceptional
$43,052
Sierra Leoneans
99.9
/100
|
#65
Exceptional
$42,868

Demographics Similar to Immigrants from Iran by Median Female Earnings

In terms of median female earnings, the demographic groups most similar to Immigrants from Iran are Immigrants from China ($46,972, a difference of 0.39%), Okinawan ($46,905, a difference of 0.53%), Immigrants from Israel ($46,902, a difference of 0.54%), Iranian ($47,421, a difference of 0.57%), and Thai ($47,577, a difference of 0.90%).
DemographicsRating | RankMedian Female Earnings
Filipinos
100.0
/100
|
#2
Exceptional
$49,508
Immigrants | Taiwan
100.0
/100
|
#3
Exceptional
$49,256
Immigrants | India
100.0
/100
|
#4
Exceptional
$48,292
Immigrants | Singapore
100.0
/100
|
#5
Exceptional
$47,986
Immigrants | Ireland
100.0
/100
|
#6
Exceptional
$47,598
Thais
100.0
/100
|
#7
Exceptional
$47,577
Iranians
100.0
/100
|
#8
Exceptional
$47,421
Immigrants | Iran
100.0
/100
|
#9
Exceptional
$47,154
Immigrants | China
100.0
/100
|
#10
Exceptional
$46,972
Okinawans
100.0
/100
|
#11
Exceptional
$46,905
Immigrants | Israel
100.0
/100
|
#12
Exceptional
$46,902
Immigrants | Australia
100.0
/100
|
#13
Exceptional
$46,573
Soviet Union
100.0
/100
|
#14
Exceptional
$46,556
Immigrants | Eastern Asia
100.0
/100
|
#15
Exceptional
$46,502
Indians (Asian)
100.0
/100
|
#16
Exceptional
$46,481