Paraguayan vs Latvian Median Female Earnings
COMPARE
Paraguayan
Latvian
Median Female Earnings
Median Female Earnings Comparison
Paraguayans
Latvians
$43,173
MEDIAN FEMALE EARNINGS
99.9/ 100
METRIC RATING
58th/ 347
METRIC RANK
$43,941
MEDIAN FEMALE EARNINGS
100.0/ 100
METRIC RATING
38th/ 347
METRIC RANK
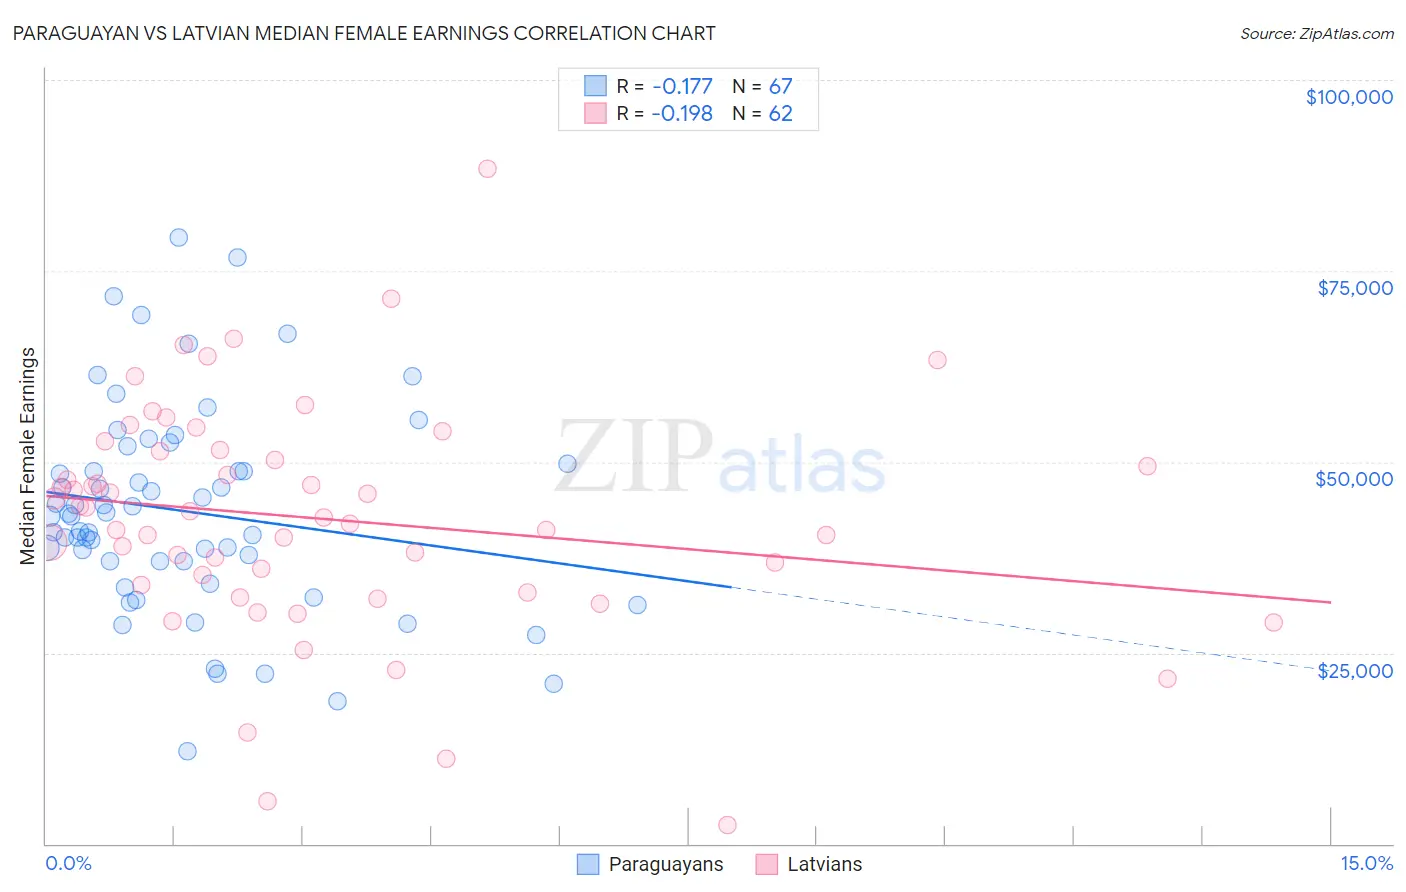
Paraguayan vs Latvian Median Female Earnings Correlation Chart
The statistical analysis conducted on geographies consisting of 95,111,705 people shows a poor negative correlation between the proportion of Paraguayans and median female earnings in the United States with a correlation coefficient (R) of -0.177 and weighted average of $43,173. Similarly, the statistical analysis conducted on geographies consisting of 220,706,355 people shows a poor negative correlation between the proportion of Latvians and median female earnings in the United States with a correlation coefficient (R) of -0.198 and weighted average of $43,941, a difference of 1.8%.
Median Female Earnings Correlation Summary
| Measurement | Paraguayan | Latvian |
| Minimum | $12,152 | $2,499 |
| Maximum | $79,410 | $88,365 |
| Range | $67,258 | $85,866 |
| Mean | $43,505 | $42,555 |
| Median | $42,896 | $43,118 |
| Interquartile 25% (IQ1) | $37,010 | $33,868 |
| Interquartile 75% (IQ3) | $49,789 | $51,451 |
| Interquartile Range (IQR) | $12,779 | $17,583 |
| Standard Deviation (Sample) | $13,576 | $15,211 |
| Standard Deviation (Population) | $13,475 | $15,087 |
Demographics Similar to Paraguayans and Latvians by Median Female Earnings
In terms of median female earnings, the demographic groups most similar to Paraguayans are Ethiopian ($43,243, a difference of 0.16%), Immigrants from Croatia ($43,258, a difference of 0.20%), Immigrants from Eastern Europe ($43,309, a difference of 0.31%), Australian ($43,308, a difference of 0.31%), and Egyptian ($43,305, a difference of 0.31%). Similarly, the demographic groups most similar to Latvians are Israeli ($43,852, a difference of 0.20%), Immigrants from Malaysia ($43,835, a difference of 0.24%), Bhutanese ($43,648, a difference of 0.67%), Immigrants from Denmark ($43,646, a difference of 0.68%), and Bulgarian ($43,638, a difference of 0.70%).
| Demographics | Rating | Rank | Median Female Earnings |
| Latvians | 100.0 /100 | #38 | Exceptional $43,941 |
| Israelis | 100.0 /100 | #39 | Exceptional $43,852 |
| Immigrants | Malaysia | 100.0 /100 | #40 | Exceptional $43,835 |
| Bhutanese | 100.0 /100 | #41 | Exceptional $43,648 |
| Immigrants | Denmark | 100.0 /100 | #42 | Exceptional $43,646 |
| Bulgarians | 100.0 /100 | #43 | Exceptional $43,638 |
| Immigrants | Czechoslovakia | 100.0 /100 | #44 | Exceptional $43,571 |
| Immigrants | Europe | 100.0 /100 | #45 | Exceptional $43,523 |
| Immigrants | Bolivia | 100.0 /100 | #46 | Exceptional $43,467 |
| Bolivians | 100.0 /100 | #47 | Exceptional $43,445 |
| Immigrants | Indonesia | 100.0 /100 | #48 | Exceptional $43,412 |
| Immigrants | Serbia | 100.0 /100 | #49 | Exceptional $43,385 |
| Immigrants | Uzbekistan | 100.0 /100 | #50 | Exceptional $43,363 |
| Maltese | 100.0 /100 | #51 | Exceptional $43,357 |
| Immigrants | Lithuania | 99.9 /100 | #52 | Exceptional $43,317 |
| Immigrants | Eastern Europe | 99.9 /100 | #53 | Exceptional $43,309 |
| Australians | 99.9 /100 | #54 | Exceptional $43,308 |
| Egyptians | 99.9 /100 | #55 | Exceptional $43,305 |
| Immigrants | Croatia | 99.9 /100 | #56 | Exceptional $43,258 |
| Ethiopians | 99.9 /100 | #57 | Exceptional $43,243 |
| Paraguayans | 99.9 /100 | #58 | Exceptional $43,173 |