Panamanian vs Ghanaian Wage/Income Gap
COMPARE
Panamanian
Ghanaian
Wage/Income Gap
Wage/Income Gap Comparison
Panamanians
Ghanaians
24.4%
WAGE/INCOME GAP
96.5/ 100
METRIC RATING
114th/ 347
METRIC RANK
22.3%
WAGE/INCOME GAP
100.0/ 100
METRIC RATING
57th/ 347
METRIC RANK
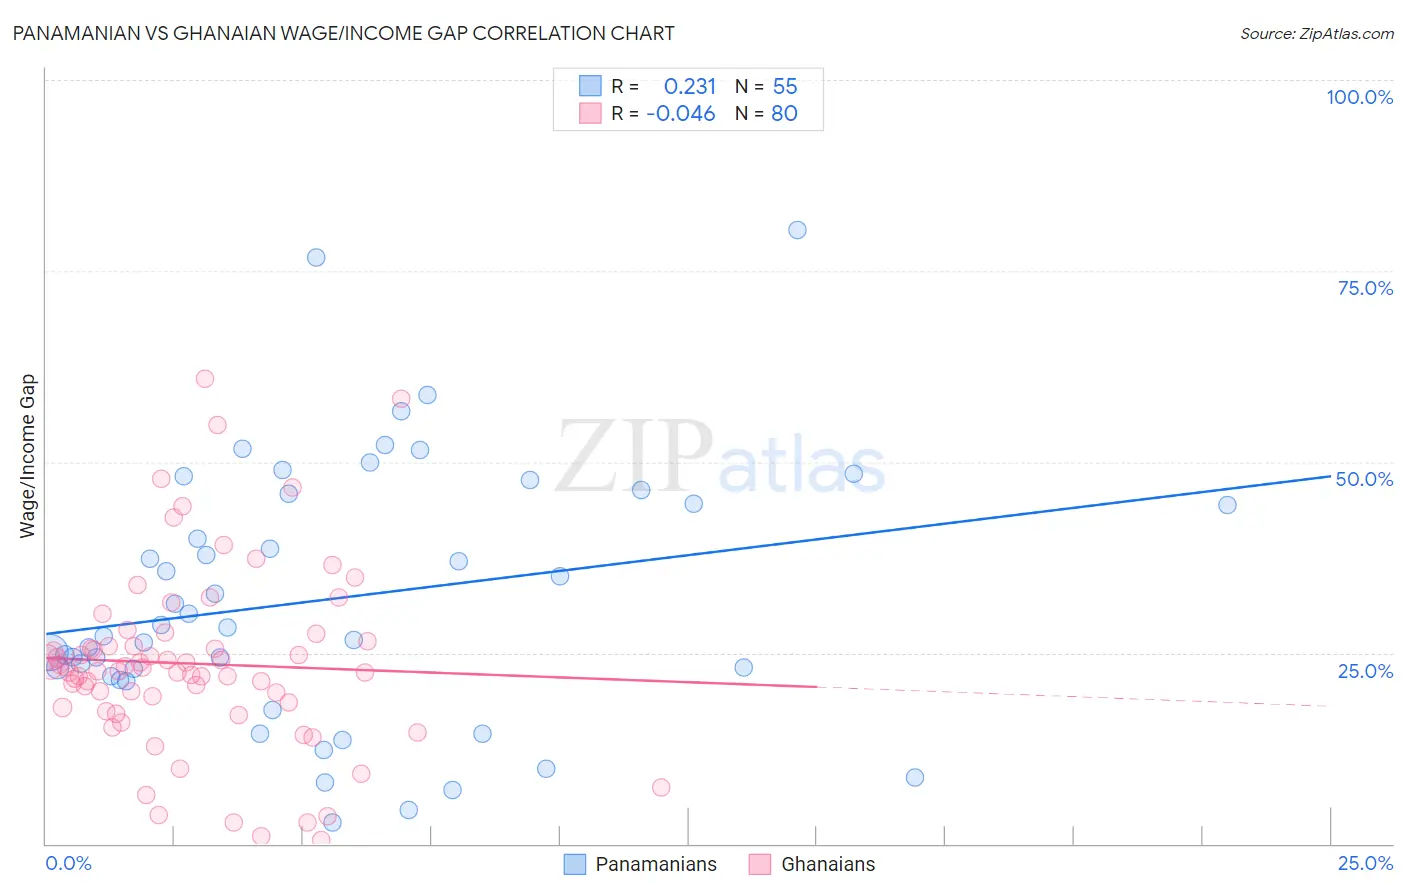
Panamanian vs Ghanaian Wage/Income Gap Correlation Chart
The statistical analysis conducted on geographies consisting of 281,143,702 people shows a weak positive correlation between the proportion of Panamanians and wage/income gap percentage in the United States with a correlation coefficient (R) of 0.231 and weighted average of 24.4%. Similarly, the statistical analysis conducted on geographies consisting of 190,692,121 people shows no correlation between the proportion of Ghanaians and wage/income gap percentage in the United States with a correlation coefficient (R) of -0.046 and weighted average of 22.3%, a difference of 9.1%.
Wage/Income Gap Correlation Summary
| Measurement | Panamanian | Ghanaian |
| Minimum | 2.8% | 0.52% |
| Maximum | 80.4% | 60.8% |
| Range | 77.6% | 60.3% |
| Mean | 32.1% | 23.6% |
| Median | 28.3% | 22.8% |
| Interquartile 25% (IQ1) | 22.0% | 18.1% |
| Interquartile 75% (IQ3) | 45.8% | 26.2% |
| Interquartile Range (IQR) | 23.8% | 8.0% |
| Standard Deviation (Sample) | 17.0% | 11.9% |
| Standard Deviation (Population) | 16.9% | 11.8% |
Similar Demographics by Wage/Income Gap
Demographics Similar to Panamanians by Wage/Income Gap
In terms of wage/income gap, the demographic groups most similar to Panamanians are Immigrants from Kenya (24.4%, a difference of 0.060%), Sioux (24.3%, a difference of 0.20%), Alaska Native (24.4%, a difference of 0.23%), Immigrants from Colombia (24.3%, a difference of 0.25%), and Immigrants from Afghanistan (24.4%, a difference of 0.29%).
| Demographics | Rating | Rank | Wage/Income Gap |
| Yaqui | 98.4 /100 | #107 | Exceptional 24.0% |
| Immigrants | Albania | 98.4 /100 | #108 | Exceptional 24.0% |
| Ugandans | 98.3 /100 | #109 | Exceptional 24.1% |
| Immigrants | Morocco | 98.1 /100 | #110 | Exceptional 24.1% |
| Soviet Union | 97.6 /100 | #111 | Exceptional 24.2% |
| Immigrants | Colombia | 97.0 /100 | #112 | Exceptional 24.3% |
| Sioux | 96.9 /100 | #113 | Exceptional 24.3% |
| Panamanians | 96.5 /100 | #114 | Exceptional 24.4% |
| Immigrants | Kenya | 96.4 /100 | #115 | Exceptional 24.4% |
| Alaska Natives | 96.0 /100 | #116 | Exceptional 24.4% |
| Immigrants | Afghanistan | 95.9 /100 | #117 | Exceptional 24.4% |
| Immigrants | Micronesia | 95.8 /100 | #118 | Exceptional 24.4% |
| Kenyans | 95.8 /100 | #119 | Exceptional 24.5% |
| Cree | 95.6 /100 | #120 | Exceptional 24.5% |
| Immigrants | Thailand | 94.9 /100 | #121 | Exceptional 24.5% |
Demographics Similar to Ghanaians by Wage/Income Gap
In terms of wage/income gap, the demographic groups most similar to Ghanaians are Immigrants from Cuba (22.4%, a difference of 0.080%), Immigrants from Ghana (22.3%, a difference of 0.10%), Navajo (22.4%, a difference of 0.12%), Immigrants from Zaire (22.3%, a difference of 0.13%), and Immigrants from Middle Africa (22.4%, a difference of 0.14%).
| Demographics | Rating | Rank | Wage/Income Gap |
| Immigrants | Western Africa | 100.0 /100 | #50 | Exceptional 22.0% |
| Tohono O'odham | 100.0 /100 | #51 | Exceptional 22.1% |
| Immigrants | Cameroon | 100.0 /100 | #52 | Exceptional 22.2% |
| Bangladeshis | 100.0 /100 | #53 | Exceptional 22.2% |
| Nepalese | 100.0 /100 | #54 | Exceptional 22.2% |
| Immigrants | Zaire | 100.0 /100 | #55 | Exceptional 22.3% |
| Immigrants | Ghana | 100.0 /100 | #56 | Exceptional 22.3% |
| Ghanaians | 100.0 /100 | #57 | Exceptional 22.3% |
| Immigrants | Cuba | 100.0 /100 | #58 | Exceptional 22.4% |
| Navajo | 100.0 /100 | #59 | Exceptional 22.4% |
| Immigrants | Middle Africa | 100.0 /100 | #60 | Exceptional 22.4% |
| Immigrants | Fiji | 100.0 /100 | #61 | Exceptional 22.4% |
| Immigrants | Guatemala | 100.0 /100 | #62 | Exceptional 22.5% |
| Immigrants | Ecuador | 100.0 /100 | #63 | Exceptional 22.5% |
| Spanish American Indians | 100.0 /100 | #64 | Exceptional 22.5% |