Panamanian vs Immigrants from France Wage/Income Gap
COMPARE
Panamanian
Immigrants from France
Wage/Income Gap
Wage/Income Gap Comparison
Panamanians
Immigrants from France
24.4%
WAGE/INCOME GAP
96.5/ 100
METRIC RATING
114th/ 347
METRIC RANK
27.4%
WAGE/INCOME GAP
2.1/ 100
METRIC RATING
255th/ 347
METRIC RANK
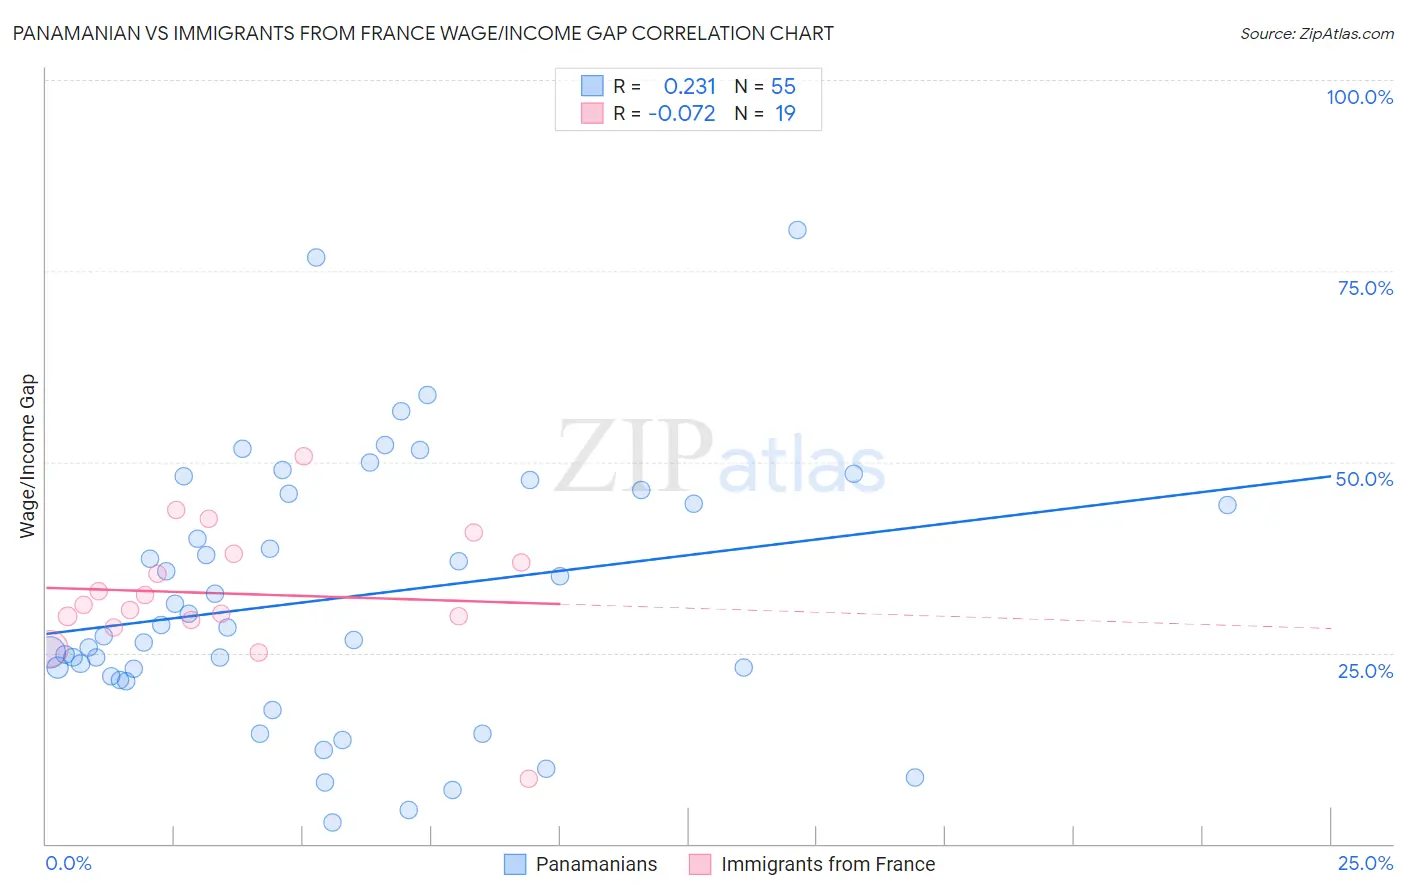
Panamanian vs Immigrants from France Wage/Income Gap Correlation Chart
The statistical analysis conducted on geographies consisting of 281,143,702 people shows a weak positive correlation between the proportion of Panamanians and wage/income gap percentage in the United States with a correlation coefficient (R) of 0.231 and weighted average of 24.4%. Similarly, the statistical analysis conducted on geographies consisting of 287,766,444 people shows a slight negative correlation between the proportion of Immigrants from France and wage/income gap percentage in the United States with a correlation coefficient (R) of -0.072 and weighted average of 27.4%, a difference of 12.4%.
Wage/Income Gap Correlation Summary
| Measurement | Panamanian | Immigrants from France |
| Minimum | 2.8% | 8.5% |
| Maximum | 80.4% | 50.8% |
| Range | 77.6% | 42.2% |
| Mean | 32.1% | 32.7% |
| Median | 28.3% | 31.3% |
| Interquartile 25% (IQ1) | 22.0% | 29.3% |
| Interquartile 75% (IQ3) | 45.8% | 37.9% |
| Interquartile Range (IQR) | 23.8% | 8.6% |
| Standard Deviation (Sample) | 17.0% | 8.9% |
| Standard Deviation (Population) | 16.9% | 8.6% |
Similar Demographics by Wage/Income Gap
Demographics Similar to Panamanians by Wage/Income Gap
In terms of wage/income gap, the demographic groups most similar to Panamanians are Immigrants from Kenya (24.4%, a difference of 0.060%), Sioux (24.3%, a difference of 0.20%), Alaska Native (24.4%, a difference of 0.23%), Immigrants from Colombia (24.3%, a difference of 0.25%), and Immigrants from Afghanistan (24.4%, a difference of 0.29%).
| Demographics | Rating | Rank | Wage/Income Gap |
| Yaqui | 98.4 /100 | #107 | Exceptional 24.0% |
| Immigrants | Albania | 98.4 /100 | #108 | Exceptional 24.0% |
| Ugandans | 98.3 /100 | #109 | Exceptional 24.1% |
| Immigrants | Morocco | 98.1 /100 | #110 | Exceptional 24.1% |
| Soviet Union | 97.6 /100 | #111 | Exceptional 24.2% |
| Immigrants | Colombia | 97.0 /100 | #112 | Exceptional 24.3% |
| Sioux | 96.9 /100 | #113 | Exceptional 24.3% |
| Panamanians | 96.5 /100 | #114 | Exceptional 24.4% |
| Immigrants | Kenya | 96.4 /100 | #115 | Exceptional 24.4% |
| Alaska Natives | 96.0 /100 | #116 | Exceptional 24.4% |
| Immigrants | Afghanistan | 95.9 /100 | #117 | Exceptional 24.4% |
| Immigrants | Micronesia | 95.8 /100 | #118 | Exceptional 24.4% |
| Kenyans | 95.8 /100 | #119 | Exceptional 24.5% |
| Cree | 95.6 /100 | #120 | Exceptional 24.5% |
| Immigrants | Thailand | 94.9 /100 | #121 | Exceptional 24.5% |
Demographics Similar to Immigrants from France by Wage/Income Gap
In terms of wage/income gap, the demographic groups most similar to Immigrants from France are Israeli (27.4%, a difference of 0.010%), Portuguese (27.4%, a difference of 0.090%), Cherokee (27.4%, a difference of 0.10%), Luxembourger (27.4%, a difference of 0.15%), and Slavic (27.4%, a difference of 0.19%).
| Demographics | Rating | Rank | Wage/Income Gap |
| Cypriots | 2.8 /100 | #248 | Tragic 27.3% |
| Carpatho Rusyns | 2.7 /100 | #249 | Tragic 27.3% |
| Immigrants | Czechoslovakia | 2.7 /100 | #250 | Tragic 27.3% |
| Immigrants | Norway | 2.5 /100 | #251 | Tragic 27.3% |
| Ukrainians | 2.4 /100 | #252 | Tragic 27.3% |
| Portuguese | 2.2 /100 | #253 | Tragic 27.4% |
| Israelis | 2.1 /100 | #254 | Tragic 27.4% |
| Immigrants | France | 2.1 /100 | #255 | Tragic 27.4% |
| Cherokee | 1.9 /100 | #256 | Tragic 27.4% |
| Luxembourgers | 1.9 /100 | #257 | Tragic 27.4% |
| Slavs | 1.8 /100 | #258 | Tragic 27.4% |
| Icelanders | 1.8 /100 | #259 | Tragic 27.5% |
| Tongans | 1.7 /100 | #260 | Tragic 27.5% |
| Immigrants | Germany | 1.5 /100 | #261 | Tragic 27.5% |
| Immigrants | Lebanon | 1.5 /100 | #262 | Tragic 27.5% |