Panamanian vs Immigrants from Dominica Wage/Income Gap
COMPARE
Panamanian
Immigrants from Dominica
Wage/Income Gap
Wage/Income Gap Comparison
Panamanians
Immigrants from Dominica
24.4%
WAGE/INCOME GAP
96.5/ 100
METRIC RATING
114th/ 347
METRIC RANK
20.0%
WAGE/INCOME GAP
100.0/ 100
METRIC RATING
19th/ 347
METRIC RANK
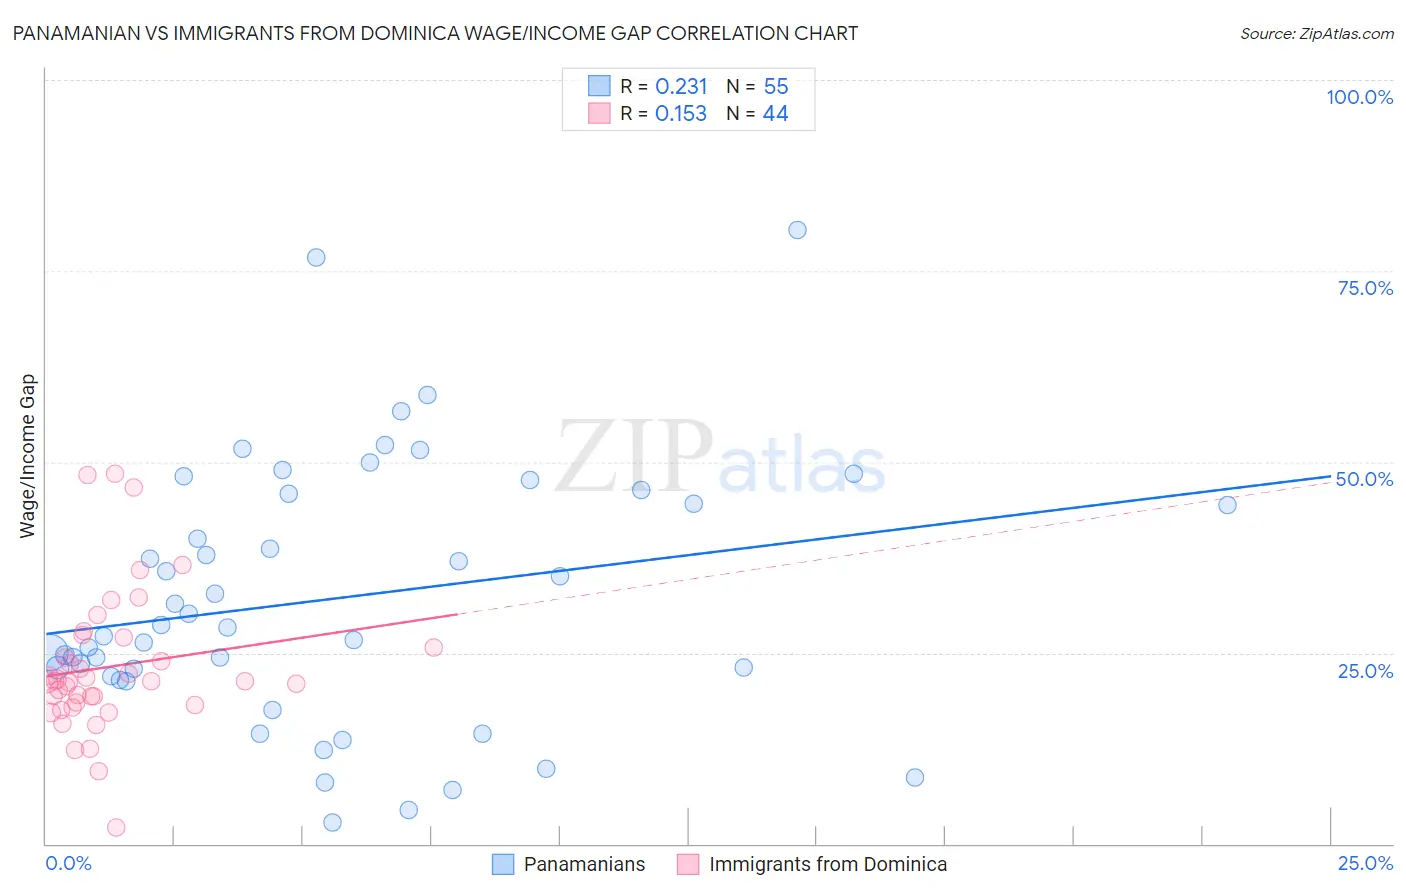
Panamanian vs Immigrants from Dominica Wage/Income Gap Correlation Chart
The statistical analysis conducted on geographies consisting of 281,143,702 people shows a weak positive correlation between the proportion of Panamanians and wage/income gap percentage in the United States with a correlation coefficient (R) of 0.231 and weighted average of 24.4%. Similarly, the statistical analysis conducted on geographies consisting of 83,787,019 people shows a poor positive correlation between the proportion of Immigrants from Dominica and wage/income gap percentage in the United States with a correlation coefficient (R) of 0.153 and weighted average of 20.0%, a difference of 21.7%.
Wage/Income Gap Correlation Summary
| Measurement | Panamanian | Immigrants from Dominica |
| Minimum | 2.8% | 2.0% |
| Maximum | 80.4% | 48.5% |
| Range | 77.6% | 46.4% |
| Mean | 32.1% | 23.2% |
| Median | 28.3% | 21.3% |
| Interquartile 25% (IQ1) | 22.0% | 18.4% |
| Interquartile 75% (IQ3) | 45.8% | 26.4% |
| Interquartile Range (IQR) | 23.8% | 8.0% |
| Standard Deviation (Sample) | 17.0% | 9.3% |
| Standard Deviation (Population) | 16.9% | 9.2% |
Similar Demographics by Wage/Income Gap
Demographics Similar to Panamanians by Wage/Income Gap
In terms of wage/income gap, the demographic groups most similar to Panamanians are Immigrants from Kenya (24.4%, a difference of 0.060%), Sioux (24.3%, a difference of 0.20%), Alaska Native (24.4%, a difference of 0.23%), Immigrants from Colombia (24.3%, a difference of 0.25%), and Immigrants from Afghanistan (24.4%, a difference of 0.29%).
| Demographics | Rating | Rank | Wage/Income Gap |
| Yaqui | 98.4 /100 | #107 | Exceptional 24.0% |
| Immigrants | Albania | 98.4 /100 | #108 | Exceptional 24.0% |
| Ugandans | 98.3 /100 | #109 | Exceptional 24.1% |
| Immigrants | Morocco | 98.1 /100 | #110 | Exceptional 24.1% |
| Soviet Union | 97.6 /100 | #111 | Exceptional 24.2% |
| Immigrants | Colombia | 97.0 /100 | #112 | Exceptional 24.3% |
| Sioux | 96.9 /100 | #113 | Exceptional 24.3% |
| Panamanians | 96.5 /100 | #114 | Exceptional 24.4% |
| Immigrants | Kenya | 96.4 /100 | #115 | Exceptional 24.4% |
| Alaska Natives | 96.0 /100 | #116 | Exceptional 24.4% |
| Immigrants | Afghanistan | 95.9 /100 | #117 | Exceptional 24.4% |
| Immigrants | Micronesia | 95.8 /100 | #118 | Exceptional 24.4% |
| Kenyans | 95.8 /100 | #119 | Exceptional 24.5% |
| Cree | 95.6 /100 | #120 | Exceptional 24.5% |
| Immigrants | Thailand | 94.9 /100 | #121 | Exceptional 24.5% |
Demographics Similar to Immigrants from Dominica by Wage/Income Gap
In terms of wage/income gap, the demographic groups most similar to Immigrants from Dominica are Hopi (20.0%, a difference of 0.060%), Bahamian (20.2%, a difference of 1.1%), Haitian (19.7%, a difference of 1.4%), Immigrants from Caribbean (20.4%, a difference of 1.8%), and Jamaican (19.6%, a difference of 2.2%).
| Demographics | Rating | Rank | Wage/Income Gap |
| Immigrants | West Indies | 100.0 /100 | #12 | Exceptional 19.2% |
| Trinidadians and Tobagonians | 100.0 /100 | #13 | Exceptional 19.3% |
| Immigrants | Trinidad and Tobago | 100.0 /100 | #14 | Exceptional 19.3% |
| West Indians | 100.0 /100 | #15 | Exceptional 19.6% |
| Jamaicans | 100.0 /100 | #16 | Exceptional 19.6% |
| Haitians | 100.0 /100 | #17 | Exceptional 19.7% |
| Hopi | 100.0 /100 | #18 | Exceptional 20.0% |
| Immigrants | Dominica | 100.0 /100 | #19 | Exceptional 20.0% |
| Bahamians | 100.0 /100 | #20 | Exceptional 20.2% |
| Immigrants | Caribbean | 100.0 /100 | #21 | Exceptional 20.4% |
| Immigrants | Liberia | 100.0 /100 | #22 | Exceptional 20.6% |
| Immigrants | Dominican Republic | 100.0 /100 | #23 | Exceptional 20.6% |
| Dominicans | 100.0 /100 | #24 | Exceptional 20.6% |
| Senegalese | 100.0 /100 | #25 | Exceptional 20.7% |
| Pueblo | 100.0 /100 | #26 | Exceptional 20.7% |