Pakistani vs Thai Wage/Income Gap
COMPARE
Pakistani
Thai
Wage/Income Gap
Wage/Income Gap Comparison
Pakistanis
Thais
26.1%
WAGE/INCOME GAP
33.7/ 100
METRIC RATING
185th/ 347
METRIC RANK
30.5%
WAGE/INCOME GAP
0.0/ 100
METRIC RATING
341st/ 347
METRIC RANK
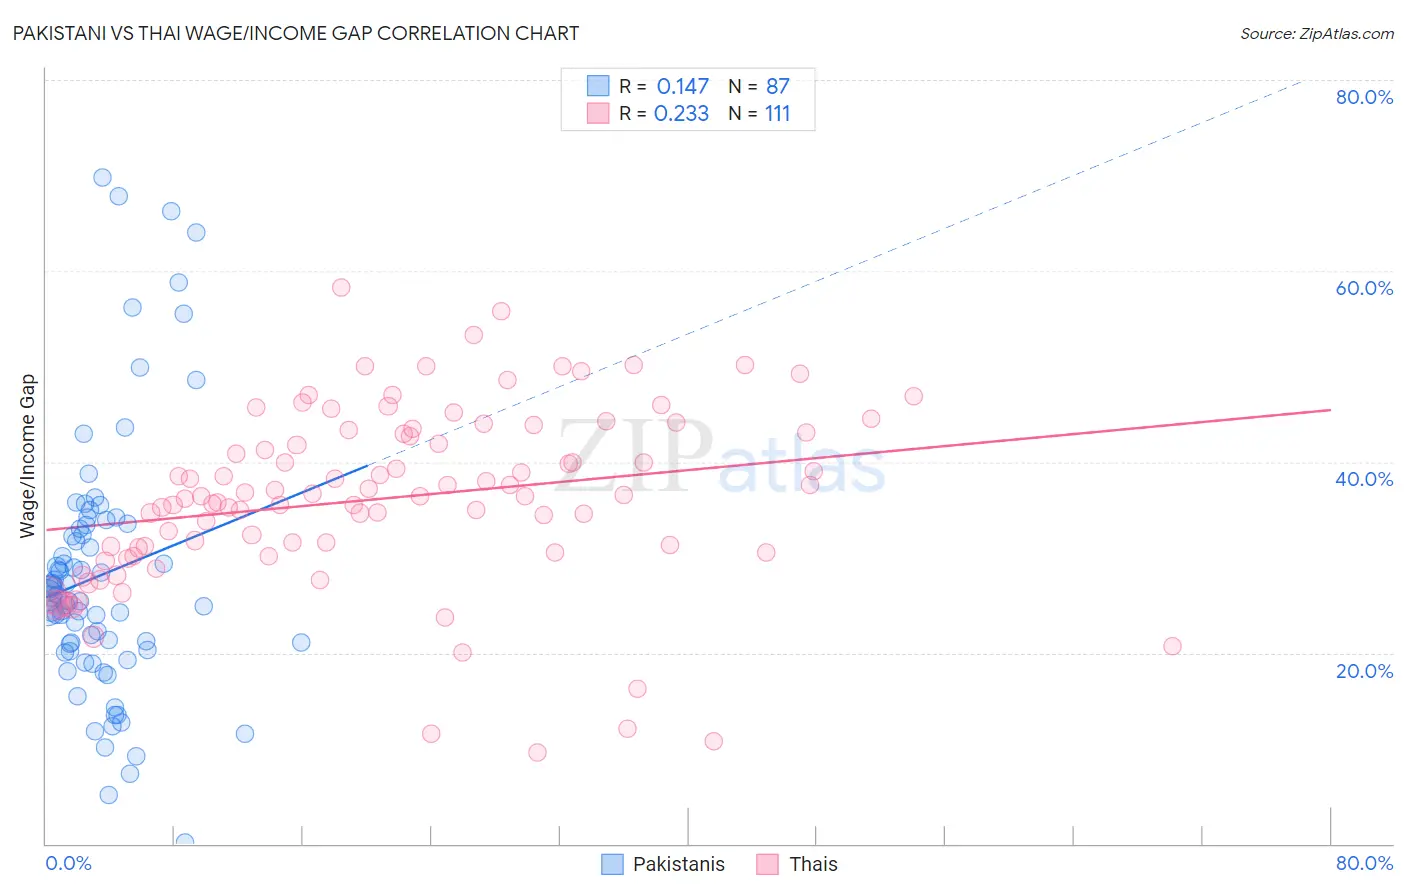
Pakistani vs Thai Wage/Income Gap Correlation Chart
The statistical analysis conducted on geographies consisting of 335,237,953 people shows a poor positive correlation between the proportion of Pakistanis and wage/income gap percentage in the United States with a correlation coefficient (R) of 0.147 and weighted average of 26.1%. Similarly, the statistical analysis conducted on geographies consisting of 475,429,891 people shows a weak positive correlation between the proportion of Thais and wage/income gap percentage in the United States with a correlation coefficient (R) of 0.233 and weighted average of 30.5%, a difference of 16.9%.
Wage/Income Gap Correlation Summary
| Measurement | Pakistani | Thai |
| Minimum | 0.10% | 9.5% |
| Maximum | 69.7% | 58.3% |
| Range | 69.6% | 48.7% |
| Mean | 28.1% | 36.2% |
| Median | 26.1% | 36.4% |
| Interquartile 25% (IQ1) | 20.3% | 30.5% |
| Interquartile 75% (IQ3) | 33.4% | 43.1% |
| Interquartile Range (IQR) | 13.1% | 12.6% |
| Standard Deviation (Sample) | 13.6% | 9.4% |
| Standard Deviation (Population) | 13.6% | 9.4% |
Similar Demographics by Wage/Income Gap
Demographics Similar to Pakistanis by Wage/Income Gap
In terms of wage/income gap, the demographic groups most similar to Pakistanis are Mexican (26.0%, a difference of 0.050%), Immigrants from Indonesia (26.1%, a difference of 0.080%), Immigrants from Kazakhstan (26.0%, a difference of 0.11%), Immigrants from Serbia (26.0%, a difference of 0.12%), and Immigrants from Bolivia (26.0%, a difference of 0.19%).
| Demographics | Rating | Rank | Wage/Income Gap |
| Chinese | 42.0 /100 | #178 | Average 25.9% |
| Samoans | 38.6 /100 | #179 | Fair 26.0% |
| Guamanians/Chamorros | 38.0 /100 | #180 | Fair 26.0% |
| Immigrants | Bolivia | 36.4 /100 | #181 | Fair 26.0% |
| Immigrants | Serbia | 35.4 /100 | #182 | Fair 26.0% |
| Immigrants | Kazakhstan | 35.2 /100 | #183 | Fair 26.0% |
| Mexicans | 34.4 /100 | #184 | Fair 26.0% |
| Pakistanis | 33.7 /100 | #185 | Fair 26.1% |
| Immigrants | Indonesia | 32.5 /100 | #186 | Fair 26.1% |
| Palestinians | 29.9 /100 | #187 | Fair 26.1% |
| Immigrants | Egypt | 29.9 /100 | #188 | Fair 26.1% |
| Immigrants | Moldova | 26.6 /100 | #189 | Fair 26.2% |
| Immigrants | Croatia | 24.8 /100 | #190 | Fair 26.2% |
| Immigrants | Venezuela | 24.7 /100 | #191 | Fair 26.2% |
| Immigrants | Bulgaria | 22.5 /100 | #192 | Fair 26.3% |
Demographics Similar to Thais by Wage/Income Gap
In terms of wage/income gap, the demographic groups most similar to Thais are Pennsylvania German (30.7%, a difference of 0.77%), Danish (31.0%, a difference of 1.6%), Swiss (30.0%, a difference of 1.7%), Assyrian/Chaldean/Syriac (31.0%, a difference of 1.8%), and Iranian (29.7%, a difference of 2.5%).
| Demographics | Rating | Rank | Wage/Income Gap |
| Europeans | 0.0 /100 | #333 | Tragic 29.4% |
| Swedes | 0.0 /100 | #334 | Tragic 29.4% |
| Immigrants | Taiwan | 0.0 /100 | #335 | Tragic 29.5% |
| English | 0.0 /100 | #336 | Tragic 29.5% |
| Dutch | 0.0 /100 | #337 | Tragic 29.6% |
| Filipinos | 0.0 /100 | #338 | Tragic 29.7% |
| Iranians | 0.0 /100 | #339 | Tragic 29.7% |
| Swiss | 0.0 /100 | #340 | Tragic 30.0% |
| Thais | 0.0 /100 | #341 | Tragic 30.5% |
| Pennsylvania Germans | 0.0 /100 | #342 | Tragic 30.7% |
| Danes | 0.0 /100 | #343 | Tragic 31.0% |
| Assyrians/Chaldeans/Syriacs | 0.0 /100 | #344 | Tragic 31.0% |
| Immigrants | India | 0.0 /100 | #345 | Tragic 31.5% |
| Cajuns | 0.0 /100 | #346 | Tragic 33.9% |
| Houma | 0.0 /100 | #347 | Tragic 38.7% |