Ottawa vs Immigrants from Grenada Master's Degree
COMPARE
Ottawa
Immigrants from Grenada
Master's Degree
Master's Degree Comparison
Ottawa
Immigrants from Grenada
11.9%
MASTER'S DEGREE
0.2/ 100
METRIC RATING
284th/ 347
METRIC RANK
14.0%
MASTER'S DEGREE
11.8/ 100
METRIC RATING
224th/ 347
METRIC RANK
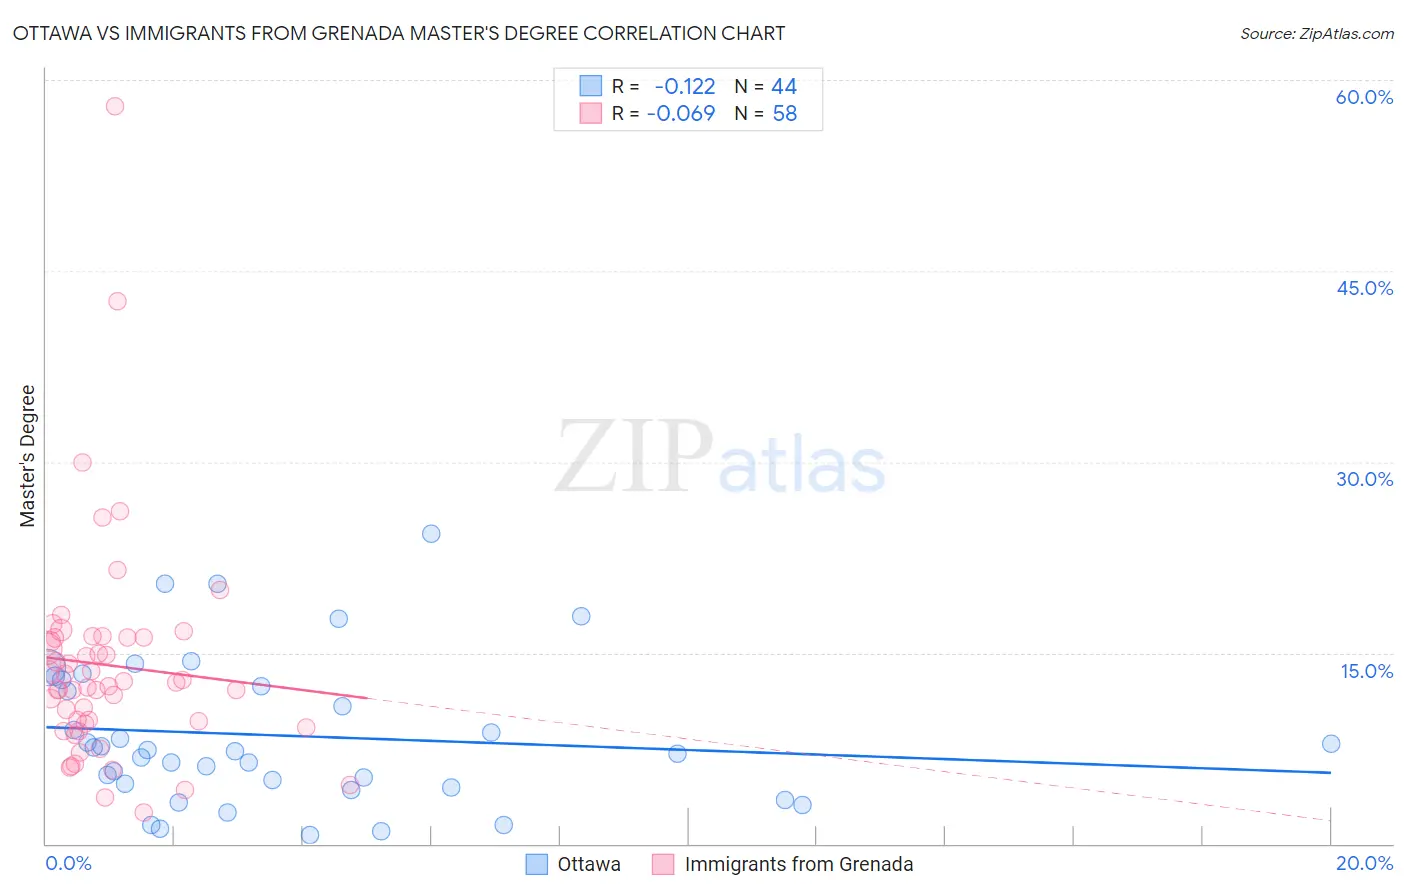
Ottawa vs Immigrants from Grenada Master's Degree Correlation Chart
The statistical analysis conducted on geographies consisting of 49,953,326 people shows a poor negative correlation between the proportion of Ottawa and percentage of population with at least master's degree education in the United States with a correlation coefficient (R) of -0.122 and weighted average of 11.9%. Similarly, the statistical analysis conducted on geographies consisting of 67,201,096 people shows a slight negative correlation between the proportion of Immigrants from Grenada and percentage of population with at least master's degree education in the United States with a correlation coefficient (R) of -0.069 and weighted average of 14.0%, a difference of 17.7%.
Master's Degree Correlation Summary
| Measurement | Ottawa | Immigrants from Grenada |
| Minimum | 0.69% | 2.4% |
| Maximum | 24.3% | 57.9% |
| Range | 23.6% | 55.5% |
| Mean | 8.5% | 14.0% |
| Median | 7.3% | 12.5% |
| Interquartile 25% (IQ1) | 4.6% | 9.5% |
| Interquartile 75% (IQ3) | 12.6% | 16.2% |
| Interquartile Range (IQR) | 8.0% | 6.7% |
| Standard Deviation (Sample) | 5.7% | 8.9% |
| Standard Deviation (Population) | 5.6% | 8.8% |
Similar Demographics by Master's Degree
Demographics Similar to Ottawa by Master's Degree
In terms of master's degree, the demographic groups most similar to Ottawa are Immigrants from Nicaragua (11.8%, a difference of 0.18%), Aleut (11.8%, a difference of 0.54%), Honduran (11.9%, a difference of 0.72%), Immigrants from Haiti (11.8%, a difference of 0.74%), and Immigrants from Honduras (11.8%, a difference of 0.90%).
| Demographics | Rating | Rank | Master's Degree |
| Immigrants | Caribbean | 0.3 /100 | #277 | Tragic 12.1% |
| Potawatomi | 0.3 /100 | #278 | Tragic 12.1% |
| Immigrants | Belize | 0.2 /100 | #279 | Tragic 12.1% |
| Immigrants | Dominican Republic | 0.2 /100 | #280 | Tragic 12.1% |
| Malaysians | 0.2 /100 | #281 | Tragic 12.0% |
| Immigrants | El Salvador | 0.2 /100 | #282 | Tragic 12.0% |
| Hondurans | 0.2 /100 | #283 | Tragic 11.9% |
| Ottawa | 0.2 /100 | #284 | Tragic 11.9% |
| Immigrants | Nicaragua | 0.2 /100 | #285 | Tragic 11.8% |
| Aleuts | 0.1 /100 | #286 | Tragic 11.8% |
| Immigrants | Haiti | 0.1 /100 | #287 | Tragic 11.8% |
| Immigrants | Honduras | 0.1 /100 | #288 | Tragic 11.8% |
| Guatemalans | 0.1 /100 | #289 | Tragic 11.7% |
| Ute | 0.1 /100 | #290 | Tragic 11.7% |
| Colville | 0.1 /100 | #291 | Tragic 11.6% |
Demographics Similar to Immigrants from Grenada by Master's Degree
In terms of master's degree, the demographic groups most similar to Immigrants from Grenada are Immigrants from South Eastern Asia (14.0%, a difference of 0.050%), Portuguese (13.9%, a difference of 0.21%), Ecuadorian (14.0%, a difference of 0.25%), Immigrants from St. Vincent and the Grenadines (13.9%, a difference of 0.26%), and Korean (14.0%, a difference of 0.28%).
| Demographics | Rating | Rank | Master's Degree |
| Immigrants | Trinidad and Tobago | 15.8 /100 | #217 | Poor 14.1% |
| French Canadians | 14.9 /100 | #218 | Poor 14.1% |
| Norwegians | 13.6 /100 | #219 | Poor 14.0% |
| Germans | 13.1 /100 | #220 | Poor 14.0% |
| Koreans | 12.7 /100 | #221 | Poor 14.0% |
| Ecuadorians | 12.6 /100 | #222 | Poor 14.0% |
| Immigrants | South Eastern Asia | 11.9 /100 | #223 | Poor 14.0% |
| Immigrants | Grenada | 11.8 /100 | #224 | Poor 14.0% |
| Portuguese | 11.2 /100 | #225 | Poor 13.9% |
| Immigrants | St. Vincent and the Grenadines | 11.0 /100 | #226 | Poor 13.9% |
| Immigrants | West Indies | 9.8 /100 | #227 | Tragic 13.9% |
| Whites/Caucasians | 9.1 /100 | #228 | Tragic 13.8% |
| British West Indians | 8.8 /100 | #229 | Tragic 13.8% |
| Dutch | 8.7 /100 | #230 | Tragic 13.8% |
| Guyanese | 7.6 /100 | #231 | Tragic 13.7% |