Slavic vs Immigrants from Grenada Median Earnings
COMPARE
Slavic
Immigrants from Grenada
Median Earnings
Median Earnings Comparison
Slavs
Immigrants from Grenada
$47,470
MEDIAN EARNINGS
81.1/ 100
METRIC RATING
153rd/ 347
METRIC RANK
$45,596
MEDIAN EARNINGS
23.6/ 100
METRIC RATING
210th/ 347
METRIC RANK
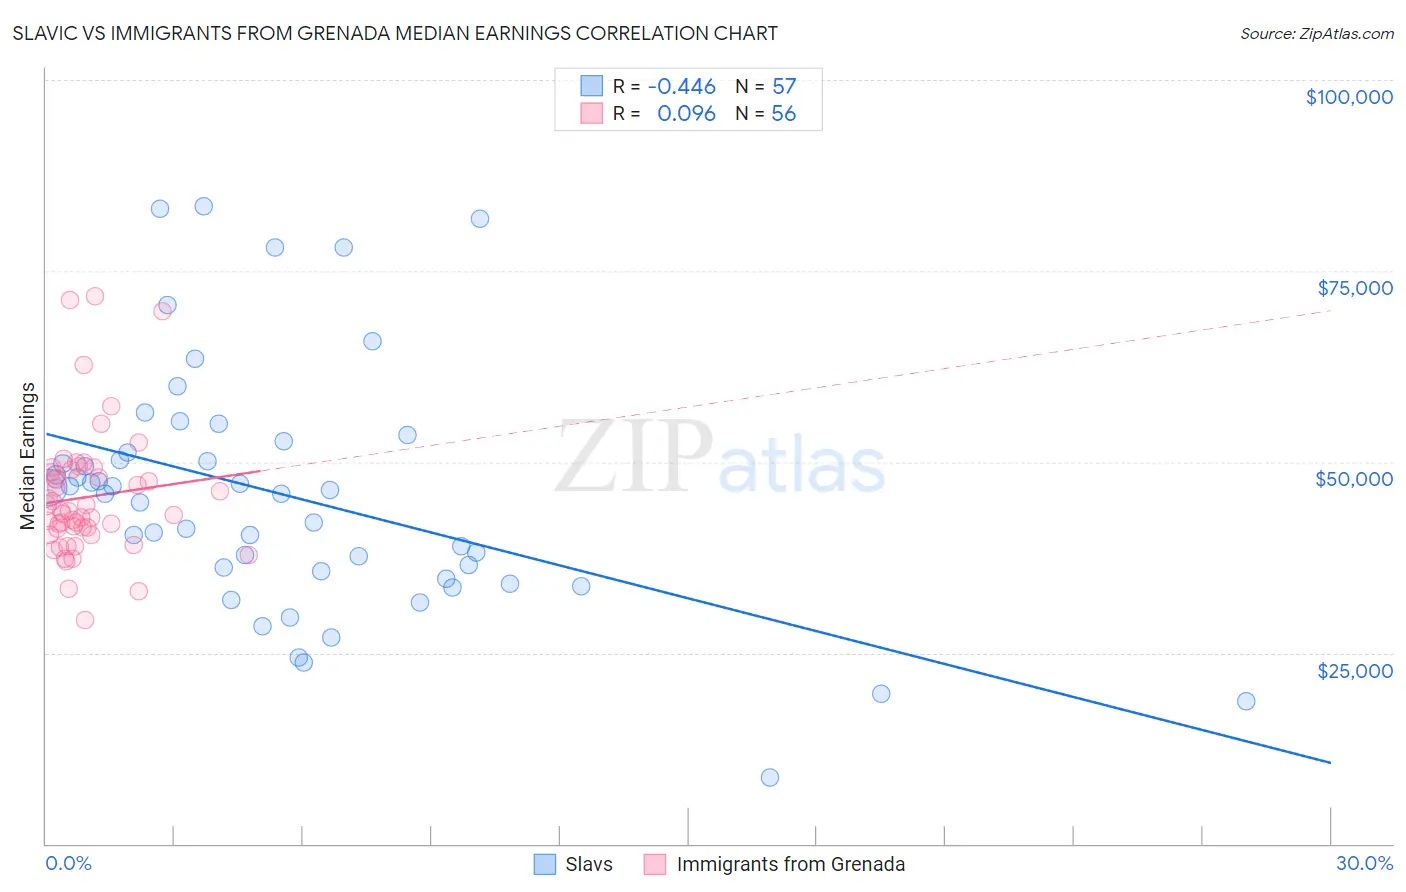
Slavic vs Immigrants from Grenada Median Earnings Correlation Chart
The statistical analysis conducted on geographies consisting of 270,868,378 people shows a moderate negative correlation between the proportion of Slavs and median earnings in the United States with a correlation coefficient (R) of -0.446 and weighted average of $47,470. Similarly, the statistical analysis conducted on geographies consisting of 67,199,447 people shows a slight positive correlation between the proportion of Immigrants from Grenada and median earnings in the United States with a correlation coefficient (R) of 0.096 and weighted average of $45,596, a difference of 4.1%.
Median Earnings Correlation Summary
| Measurement | Slavic | Immigrants from Grenada |
| Minimum | $8,672 | $29,237 |
| Maximum | $83,496 | $71,671 |
| Range | $74,824 | $42,434 |
| Mean | $45,520 | $45,405 |
| Median | $45,848 | $43,368 |
| Interquartile 25% (IQ1) | $35,213 | $40,879 |
| Interquartile 75% (IQ3) | $51,961 | $48,789 |
| Interquartile Range (IQR) | $16,749 | $7,911 |
| Standard Deviation (Sample) | $16,076 | $8,458 |
| Standard Deviation (Population) | $15,935 | $8,382 |
Similar Demographics by Median Earnings
Demographics Similar to Slavs by Median Earnings
In terms of median earnings, the demographic groups most similar to Slavs are Immigrants from Germany ($47,566, a difference of 0.20%), Immigrants from Oceania ($47,617, a difference of 0.31%), Peruvian ($47,628, a difference of 0.33%), Immigrants from Portugal ($47,304, a difference of 0.35%), and Luxembourger ($47,640, a difference of 0.36%).
| Demographics | Rating | Rank | Median Earnings |
| Immigrants | Chile | 85.5 /100 | #146 | Excellent $47,697 |
| Immigrants | South Eastern Asia | 85.0 /100 | #147 | Excellent $47,671 |
| Immigrants | Eritrea | 84.8 /100 | #148 | Excellent $47,657 |
| Luxembourgers | 84.5 /100 | #149 | Excellent $47,640 |
| Peruvians | 84.2 /100 | #150 | Excellent $47,628 |
| Immigrants | Oceania | 84.1 /100 | #151 | Excellent $47,617 |
| Immigrants | Germany | 83.1 /100 | #152 | Excellent $47,566 |
| Slavs | 81.1 /100 | #153 | Excellent $47,470 |
| Immigrants | Portugal | 77.3 /100 | #154 | Good $47,304 |
| Immigrants | Vietnam | 76.7 /100 | #155 | Good $47,282 |
| Irish | 76.6 /100 | #156 | Good $47,276 |
| Czechs | 75.1 /100 | #157 | Good $47,221 |
| Slovaks | 71.7 /100 | #158 | Good $47,095 |
| Immigrants | Peru | 69.6 /100 | #159 | Good $47,025 |
| Alsatians | 69.6 /100 | #160 | Good $47,023 |
Demographics Similar to Immigrants from Grenada by Median Earnings
In terms of median earnings, the demographic groups most similar to Immigrants from Grenada are Immigrants from Thailand ($45,598, a difference of 0.0%), Immigrants from Bosnia and Herzegovina ($45,600, a difference of 0.010%), Panamanian ($45,593, a difference of 0.010%), Bermudan ($45,593, a difference of 0.010%), and Immigrants from Senegal ($45,611, a difference of 0.030%).
| Demographics | Rating | Rank | Median Earnings |
| Welsh | 26.6 /100 | #203 | Fair $45,710 |
| Immigrants | Uruguay | 25.9 /100 | #204 | Fair $45,682 |
| Tongans | 25.4 /100 | #205 | Fair $45,665 |
| Immigrants | Ghana | 24.8 /100 | #206 | Fair $45,641 |
| Immigrants | Senegal | 24.0 /100 | #207 | Fair $45,611 |
| Immigrants | Bosnia and Herzegovina | 23.7 /100 | #208 | Fair $45,600 |
| Immigrants | Thailand | 23.7 /100 | #209 | Fair $45,598 |
| Immigrants | Grenada | 23.6 /100 | #210 | Fair $45,596 |
| Panamanians | 23.5 /100 | #211 | Fair $45,593 |
| Bermudans | 23.5 /100 | #212 | Fair $45,593 |
| Immigrants | Colombia | 22.4 /100 | #213 | Fair $45,550 |
| Nigerians | 22.0 /100 | #214 | Fair $45,532 |
| Immigrants | Bangladesh | 22.0 /100 | #215 | Fair $45,532 |
| Guyanese | 20.6 /100 | #216 | Fair $45,470 |
| Tlingit-Haida | 20.5 /100 | #217 | Fair $45,468 |