Afghan vs Immigrants from Grenada Median Earnings
COMPARE
Afghan
Immigrants from Grenada
Median Earnings
Median Earnings Comparison
Afghans
Immigrants from Grenada
$51,112
MEDIAN EARNINGS
99.9/ 100
METRIC RATING
66th/ 347
METRIC RANK
$45,596
MEDIAN EARNINGS
23.6/ 100
METRIC RATING
210th/ 347
METRIC RANK
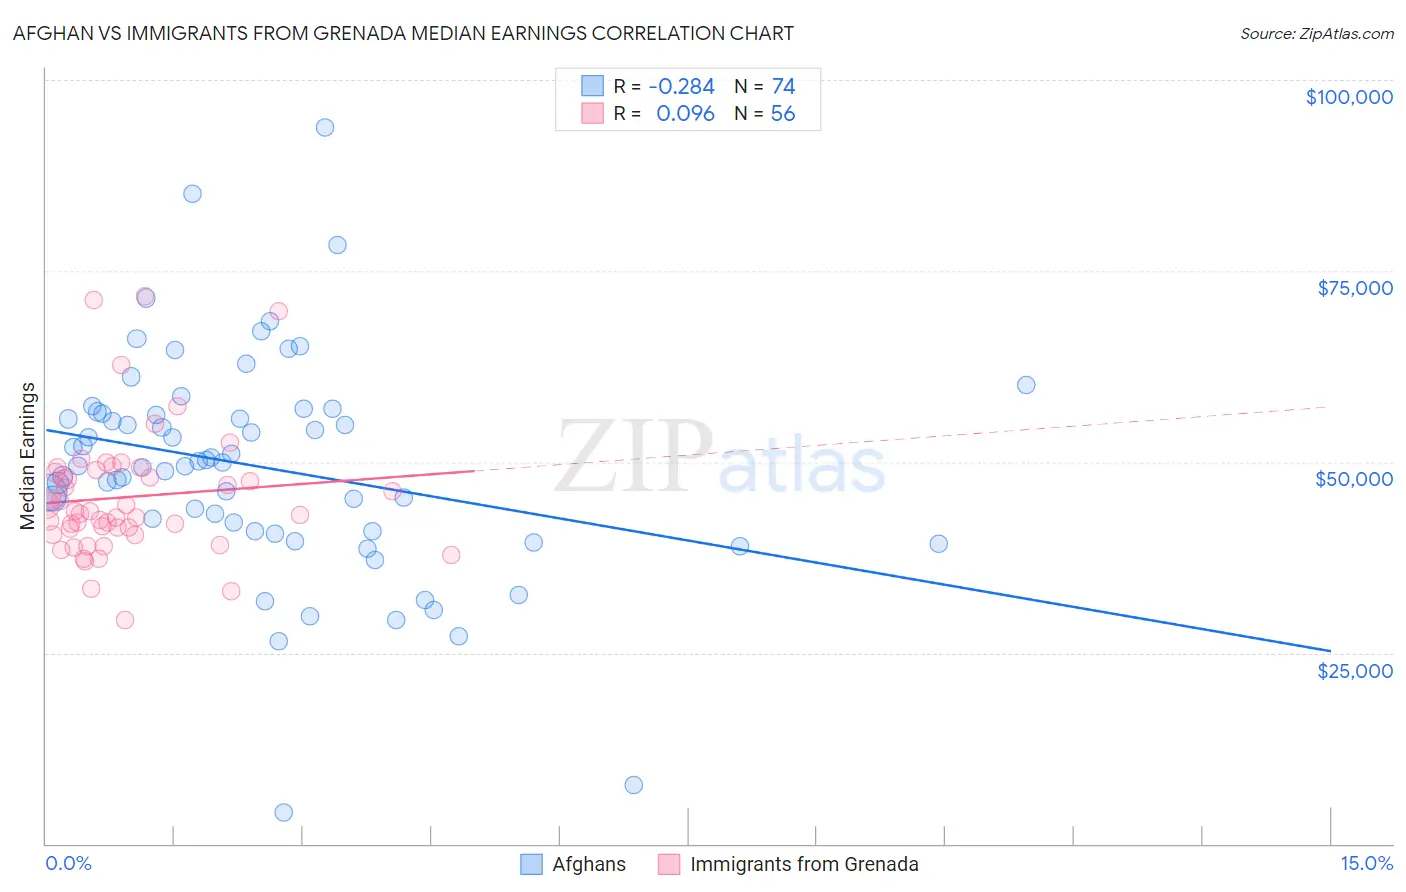
Afghan vs Immigrants from Grenada Median Earnings Correlation Chart
The statistical analysis conducted on geographies consisting of 148,874,377 people shows a weak negative correlation between the proportion of Afghans and median earnings in the United States with a correlation coefficient (R) of -0.284 and weighted average of $51,112. Similarly, the statistical analysis conducted on geographies consisting of 67,199,447 people shows a slight positive correlation between the proportion of Immigrants from Grenada and median earnings in the United States with a correlation coefficient (R) of 0.096 and weighted average of $45,596, a difference of 12.1%.
Median Earnings Correlation Summary
| Measurement | Afghan | Immigrants from Grenada |
| Minimum | $4,034 | $29,237 |
| Maximum | $93,750 | $71,671 |
| Range | $89,716 | $42,434 |
| Mean | $49,335 | $45,405 |
| Median | $49,670 | $43,368 |
| Interquartile 25% (IQ1) | $40,877 | $40,879 |
| Interquartile 75% (IQ3) | $56,283 | $48,789 |
| Interquartile Range (IQR) | $15,406 | $7,911 |
| Standard Deviation (Sample) | $14,513 | $8,458 |
| Standard Deviation (Population) | $14,415 | $8,382 |
Similar Demographics by Median Earnings
Demographics Similar to Afghans by Median Earnings
In terms of median earnings, the demographic groups most similar to Afghans are Immigrants from Spain ($51,092, a difference of 0.040%), Paraguayan ($51,068, a difference of 0.090%), Greek ($51,164, a difference of 0.10%), Mongolian ($51,038, a difference of 0.15%), and Lithuanian ($50,991, a difference of 0.24%).
| Demographics | Rating | Rank | Median Earnings |
| Immigrants | Croatia | 99.9 /100 | #59 | Exceptional $51,581 |
| Immigrants | Serbia | 99.9 /100 | #60 | Exceptional $51,557 |
| Immigrants | Latvia | 99.9 /100 | #61 | Exceptional $51,555 |
| Immigrants | Romania | 99.9 /100 | #62 | Exceptional $51,337 |
| Immigrants | Bulgaria | 99.9 /100 | #63 | Exceptional $51,318 |
| New Zealanders | 99.9 /100 | #64 | Exceptional $51,246 |
| Greeks | 99.9 /100 | #65 | Exceptional $51,164 |
| Afghans | 99.9 /100 | #66 | Exceptional $51,112 |
| Immigrants | Spain | 99.9 /100 | #67 | Exceptional $51,092 |
| Paraguayans | 99.9 /100 | #68 | Exceptional $51,068 |
| Mongolians | 99.8 /100 | #69 | Exceptional $51,038 |
| Lithuanians | 99.8 /100 | #70 | Exceptional $50,991 |
| Immigrants | Ukraine | 99.8 /100 | #71 | Exceptional $50,984 |
| Immigrants | Egypt | 99.8 /100 | #72 | Exceptional $50,901 |
| Immigrants | Netherlands | 99.8 /100 | #73 | Exceptional $50,818 |
Demographics Similar to Immigrants from Grenada by Median Earnings
In terms of median earnings, the demographic groups most similar to Immigrants from Grenada are Immigrants from Thailand ($45,598, a difference of 0.0%), Immigrants from Bosnia and Herzegovina ($45,600, a difference of 0.010%), Panamanian ($45,593, a difference of 0.010%), Bermudan ($45,593, a difference of 0.010%), and Immigrants from Senegal ($45,611, a difference of 0.030%).
| Demographics | Rating | Rank | Median Earnings |
| Welsh | 26.6 /100 | #203 | Fair $45,710 |
| Immigrants | Uruguay | 25.9 /100 | #204 | Fair $45,682 |
| Tongans | 25.4 /100 | #205 | Fair $45,665 |
| Immigrants | Ghana | 24.8 /100 | #206 | Fair $45,641 |
| Immigrants | Senegal | 24.0 /100 | #207 | Fair $45,611 |
| Immigrants | Bosnia and Herzegovina | 23.7 /100 | #208 | Fair $45,600 |
| Immigrants | Thailand | 23.7 /100 | #209 | Fair $45,598 |
| Immigrants | Grenada | 23.6 /100 | #210 | Fair $45,596 |
| Panamanians | 23.5 /100 | #211 | Fair $45,593 |
| Bermudans | 23.5 /100 | #212 | Fair $45,593 |
| Immigrants | Colombia | 22.4 /100 | #213 | Fair $45,550 |
| Nigerians | 22.0 /100 | #214 | Fair $45,532 |
| Immigrants | Bangladesh | 22.0 /100 | #215 | Fair $45,532 |
| Guyanese | 20.6 /100 | #216 | Fair $45,470 |
| Tlingit-Haida | 20.5 /100 | #217 | Fair $45,468 |