Burmese vs Immigrants from Grenada Median Earnings
COMPARE
Burmese
Immigrants from Grenada
Median Earnings
Median Earnings Comparison
Burmese
Immigrants from Grenada
$54,559
MEDIAN EARNINGS
100.0/ 100
METRIC RATING
21st/ 347
METRIC RANK
$45,596
MEDIAN EARNINGS
23.6/ 100
METRIC RATING
210th/ 347
METRIC RANK
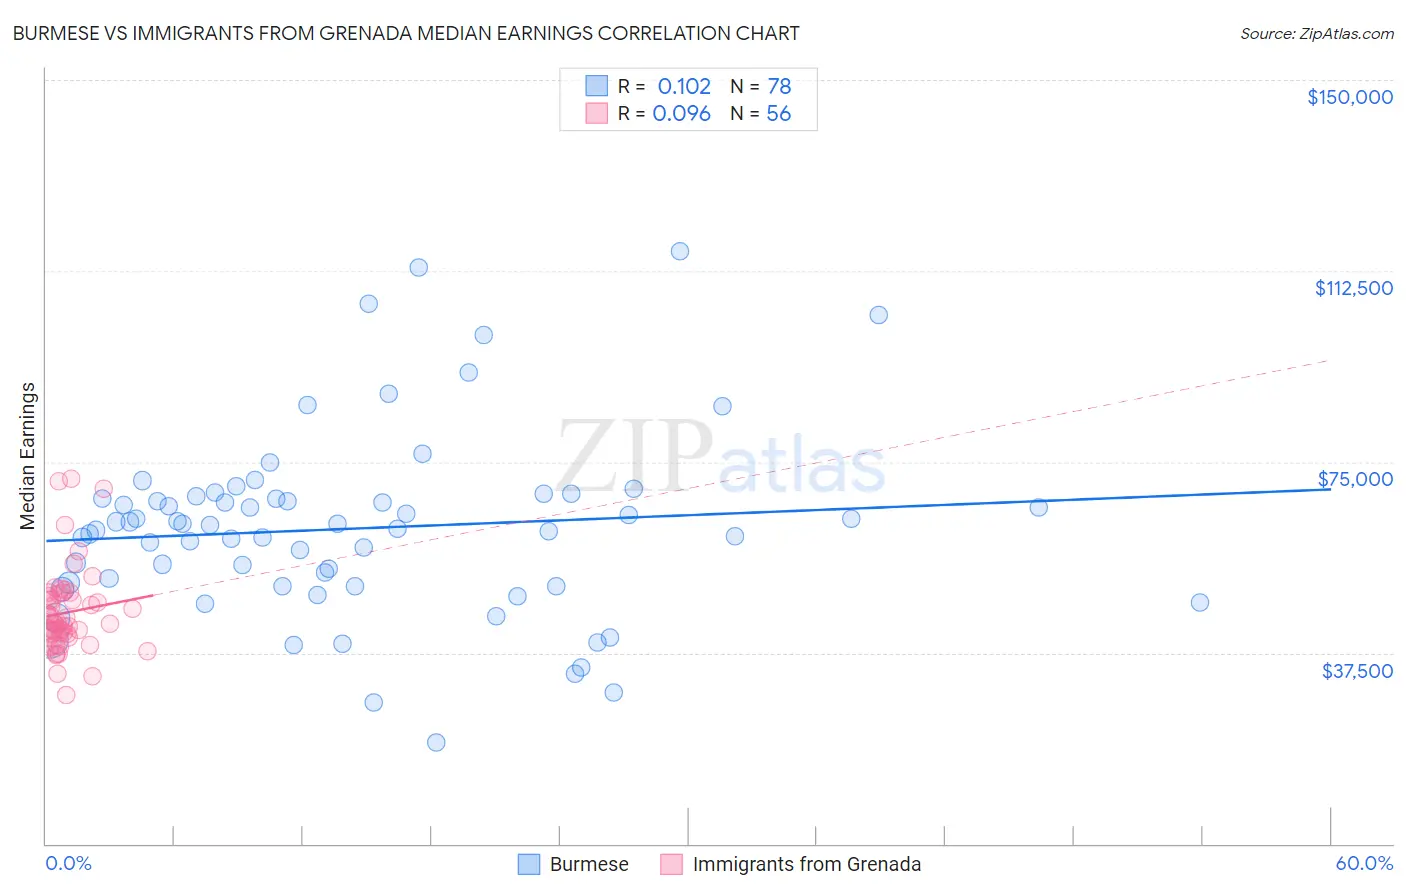
Burmese vs Immigrants from Grenada Median Earnings Correlation Chart
The statistical analysis conducted on geographies consisting of 465,399,641 people shows a poor positive correlation between the proportion of Burmese and median earnings in the United States with a correlation coefficient (R) of 0.102 and weighted average of $54,559. Similarly, the statistical analysis conducted on geographies consisting of 67,199,447 people shows a slight positive correlation between the proportion of Immigrants from Grenada and median earnings in the United States with a correlation coefficient (R) of 0.096 and weighted average of $45,596, a difference of 19.7%.
Median Earnings Correlation Summary
| Measurement | Burmese | Immigrants from Grenada |
| Minimum | $20,000 | $29,237 |
| Maximum | $116,380 | $71,671 |
| Range | $96,380 | $42,434 |
| Mean | $61,901 | $45,405 |
| Median | $62,283 | $43,368 |
| Interquartile 25% (IQ1) | $50,678 | $40,879 |
| Interquartile 75% (IQ3) | $67,756 | $48,789 |
| Interquartile Range (IQR) | $17,078 | $7,911 |
| Standard Deviation (Sample) | $18,078 | $8,458 |
| Standard Deviation (Population) | $17,962 | $8,382 |
Similar Demographics by Median Earnings
Demographics Similar to Burmese by Median Earnings
In terms of median earnings, the demographic groups most similar to Burmese are Immigrants from Korea ($54,530, a difference of 0.050%), Cypriot ($54,589, a difference of 0.060%), Immigrants from Sweden ($54,478, a difference of 0.15%), Immigrants from Belgium ($54,679, a difference of 0.22%), and Soviet Union ($54,290, a difference of 0.50%).
| Demographics | Rating | Rank | Median Earnings |
| Immigrants | Australia | 100.0 /100 | #14 | Exceptional $56,305 |
| Indians (Asian) | 100.0 /100 | #15 | Exceptional $56,253 |
| Immigrants | Eastern Asia | 100.0 /100 | #16 | Exceptional $56,183 |
| Eastern Europeans | 100.0 /100 | #17 | Exceptional $55,084 |
| Immigrants | Japan | 100.0 /100 | #18 | Exceptional $54,938 |
| Immigrants | Belgium | 100.0 /100 | #19 | Exceptional $54,679 |
| Cypriots | 100.0 /100 | #20 | Exceptional $54,589 |
| Burmese | 100.0 /100 | #21 | Exceptional $54,559 |
| Immigrants | Korea | 100.0 /100 | #22 | Exceptional $54,530 |
| Immigrants | Sweden | 100.0 /100 | #23 | Exceptional $54,478 |
| Soviet Union | 100.0 /100 | #24 | Exceptional $54,290 |
| Turks | 100.0 /100 | #25 | Exceptional $53,919 |
| Immigrants | Northern Europe | 100.0 /100 | #26 | Exceptional $53,872 |
| Asians | 100.0 /100 | #27 | Exceptional $53,690 |
| Immigrants | France | 100.0 /100 | #28 | Exceptional $53,490 |
Demographics Similar to Immigrants from Grenada by Median Earnings
In terms of median earnings, the demographic groups most similar to Immigrants from Grenada are Immigrants from Thailand ($45,598, a difference of 0.0%), Immigrants from Bosnia and Herzegovina ($45,600, a difference of 0.010%), Panamanian ($45,593, a difference of 0.010%), Bermudan ($45,593, a difference of 0.010%), and Immigrants from Senegal ($45,611, a difference of 0.030%).
| Demographics | Rating | Rank | Median Earnings |
| Welsh | 26.6 /100 | #203 | Fair $45,710 |
| Immigrants | Uruguay | 25.9 /100 | #204 | Fair $45,682 |
| Tongans | 25.4 /100 | #205 | Fair $45,665 |
| Immigrants | Ghana | 24.8 /100 | #206 | Fair $45,641 |
| Immigrants | Senegal | 24.0 /100 | #207 | Fair $45,611 |
| Immigrants | Bosnia and Herzegovina | 23.7 /100 | #208 | Fair $45,600 |
| Immigrants | Thailand | 23.7 /100 | #209 | Fair $45,598 |
| Immigrants | Grenada | 23.6 /100 | #210 | Fair $45,596 |
| Panamanians | 23.5 /100 | #211 | Fair $45,593 |
| Bermudans | 23.5 /100 | #212 | Fair $45,593 |
| Immigrants | Colombia | 22.4 /100 | #213 | Fair $45,550 |
| Nigerians | 22.0 /100 | #214 | Fair $45,532 |
| Immigrants | Bangladesh | 22.0 /100 | #215 | Fair $45,532 |
| Guyanese | 20.6 /100 | #216 | Fair $45,470 |
| Tlingit-Haida | 20.5 /100 | #217 | Fair $45,468 |