German vs Immigrants from Grenada Median Earnings
COMPARE
German
Immigrants from Grenada
Median Earnings
Median Earnings Comparison
Germans
Immigrants from Grenada
$45,935
MEDIAN EARNINGS
33.2/ 100
METRIC RATING
192nd/ 347
METRIC RANK
$45,596
MEDIAN EARNINGS
23.6/ 100
METRIC RATING
210th/ 347
METRIC RANK
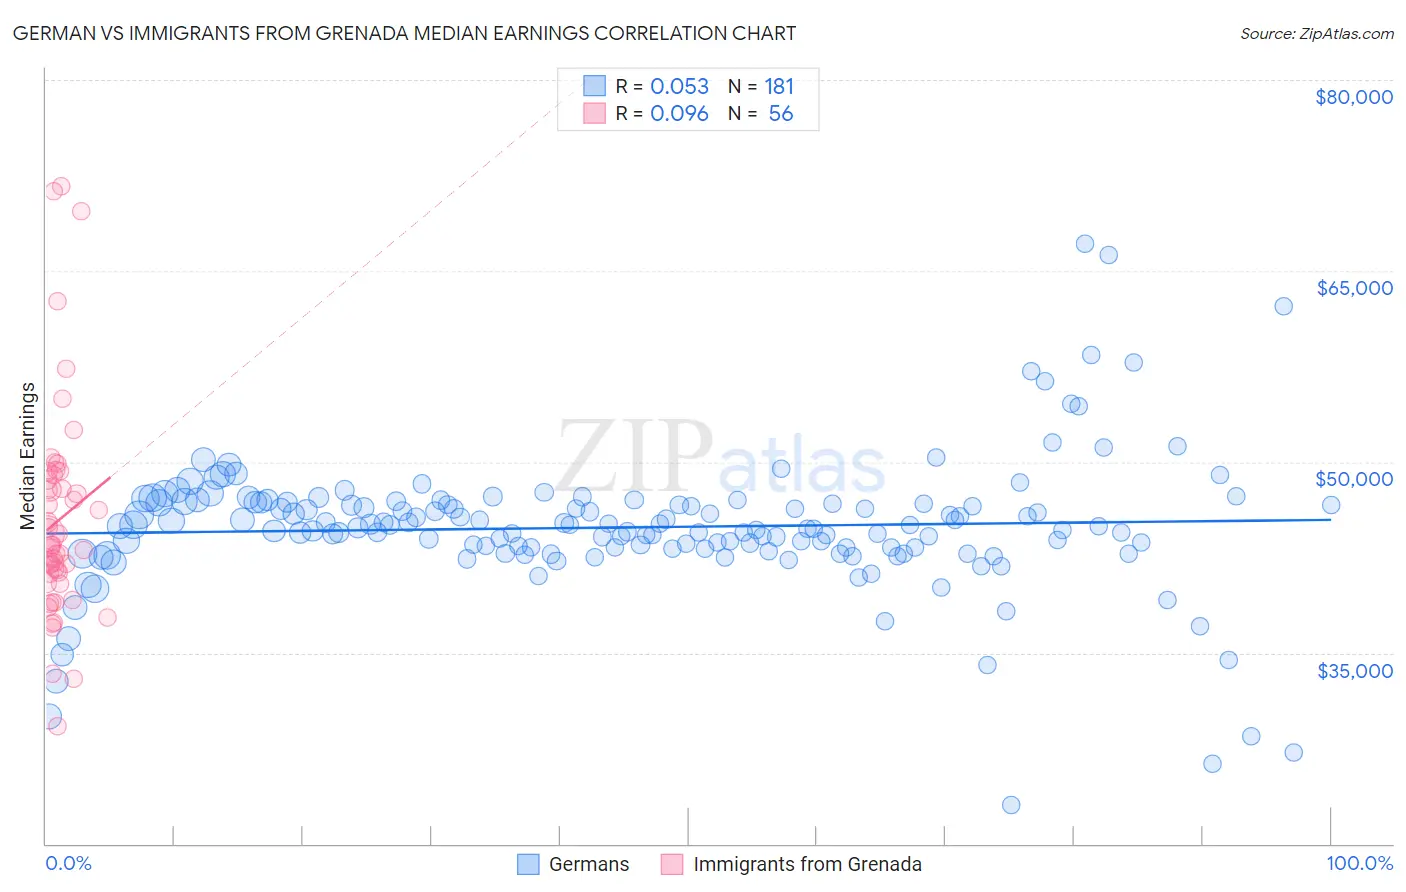
German vs Immigrants from Grenada Median Earnings Correlation Chart
The statistical analysis conducted on geographies consisting of 580,480,068 people shows a slight positive correlation between the proportion of Germans and median earnings in the United States with a correlation coefficient (R) of 0.053 and weighted average of $45,935. Similarly, the statistical analysis conducted on geographies consisting of 67,199,447 people shows a slight positive correlation between the proportion of Immigrants from Grenada and median earnings in the United States with a correlation coefficient (R) of 0.096 and weighted average of $45,596, a difference of 0.74%.
Median Earnings Correlation Summary
| Measurement | German | Immigrants from Grenada |
| Minimum | $23,082 | $29,237 |
| Maximum | $67,100 | $71,671 |
| Range | $44,018 | $42,434 |
| Mean | $44,861 | $45,405 |
| Median | $44,941 | $43,368 |
| Interquartile 25% (IQ1) | $43,214 | $40,879 |
| Interquartile 75% (IQ3) | $46,790 | $48,789 |
| Interquartile Range (IQR) | $3,576 | $7,911 |
| Standard Deviation (Sample) | $5,408 | $8,458 |
| Standard Deviation (Population) | $5,393 | $8,382 |
Demographics Similar to Germans and Immigrants from Grenada by Median Earnings
In terms of median earnings, the demographic groups most similar to Germans are Guamanian/Chamorro ($45,933, a difference of 0.0%), Finnish ($45,940, a difference of 0.010%), Immigrants from Costa Rica ($45,928, a difference of 0.020%), Immigrants from St. Vincent and the Grenadines ($45,908, a difference of 0.060%), and Yugoslavian ($45,846, a difference of 0.19%). Similarly, the demographic groups most similar to Immigrants from Grenada are Immigrants from Thailand ($45,598, a difference of 0.0%), Immigrants from Bosnia and Herzegovina ($45,600, a difference of 0.010%), Panamanian ($45,593, a difference of 0.010%), Immigrants from Senegal ($45,611, a difference of 0.030%), and Immigrants from Ghana ($45,641, a difference of 0.10%).
| Demographics | Rating | Rank | Median Earnings |
| Finns | 33.4 /100 | #191 | Fair $45,940 |
| Germans | 33.2 /100 | #192 | Fair $45,935 |
| Guamanians/Chamorros | 33.2 /100 | #193 | Fair $45,933 |
| Immigrants | Costa Rica | 33.0 /100 | #194 | Fair $45,928 |
| Immigrants | St. Vincent and the Grenadines | 32.4 /100 | #195 | Fair $45,908 |
| Yugoslavians | 30.5 /100 | #196 | Fair $45,846 |
| Barbadians | 30.5 /100 | #197 | Fair $45,846 |
| Trinidadians and Tobagonians | 29.7 /100 | #198 | Fair $45,820 |
| Immigrants | Barbados | 29.6 /100 | #199 | Fair $45,816 |
| Immigrants | Azores | 29.5 /100 | #200 | Fair $45,812 |
| Celtics | 27.2 /100 | #201 | Fair $45,732 |
| Immigrants | Trinidad and Tobago | 27.1 /100 | #202 | Fair $45,729 |
| Welsh | 26.6 /100 | #203 | Fair $45,710 |
| Immigrants | Uruguay | 25.9 /100 | #204 | Fair $45,682 |
| Tongans | 25.4 /100 | #205 | Fair $45,665 |
| Immigrants | Ghana | 24.8 /100 | #206 | Fair $45,641 |
| Immigrants | Senegal | 24.0 /100 | #207 | Fair $45,611 |
| Immigrants | Bosnia and Herzegovina | 23.7 /100 | #208 | Fair $45,600 |
| Immigrants | Thailand | 23.7 /100 | #209 | Fair $45,598 |
| Immigrants | Grenada | 23.6 /100 | #210 | Fair $45,596 |
| Panamanians | 23.5 /100 | #211 | Fair $45,593 |