Ottawa vs Immigrants from Grenada Female Disability
COMPARE
Ottawa
Immigrants from Grenada
Female Disability
Female Disability Comparison
Ottawa
Immigrants from Grenada
14.2%
FEMALE DISABILITY
0.0/ 100
METRIC RATING
327th/ 347
METRIC RANK
12.4%
FEMALE DISABILITY
20.5/ 100
METRIC RATING
205th/ 347
METRIC RANK
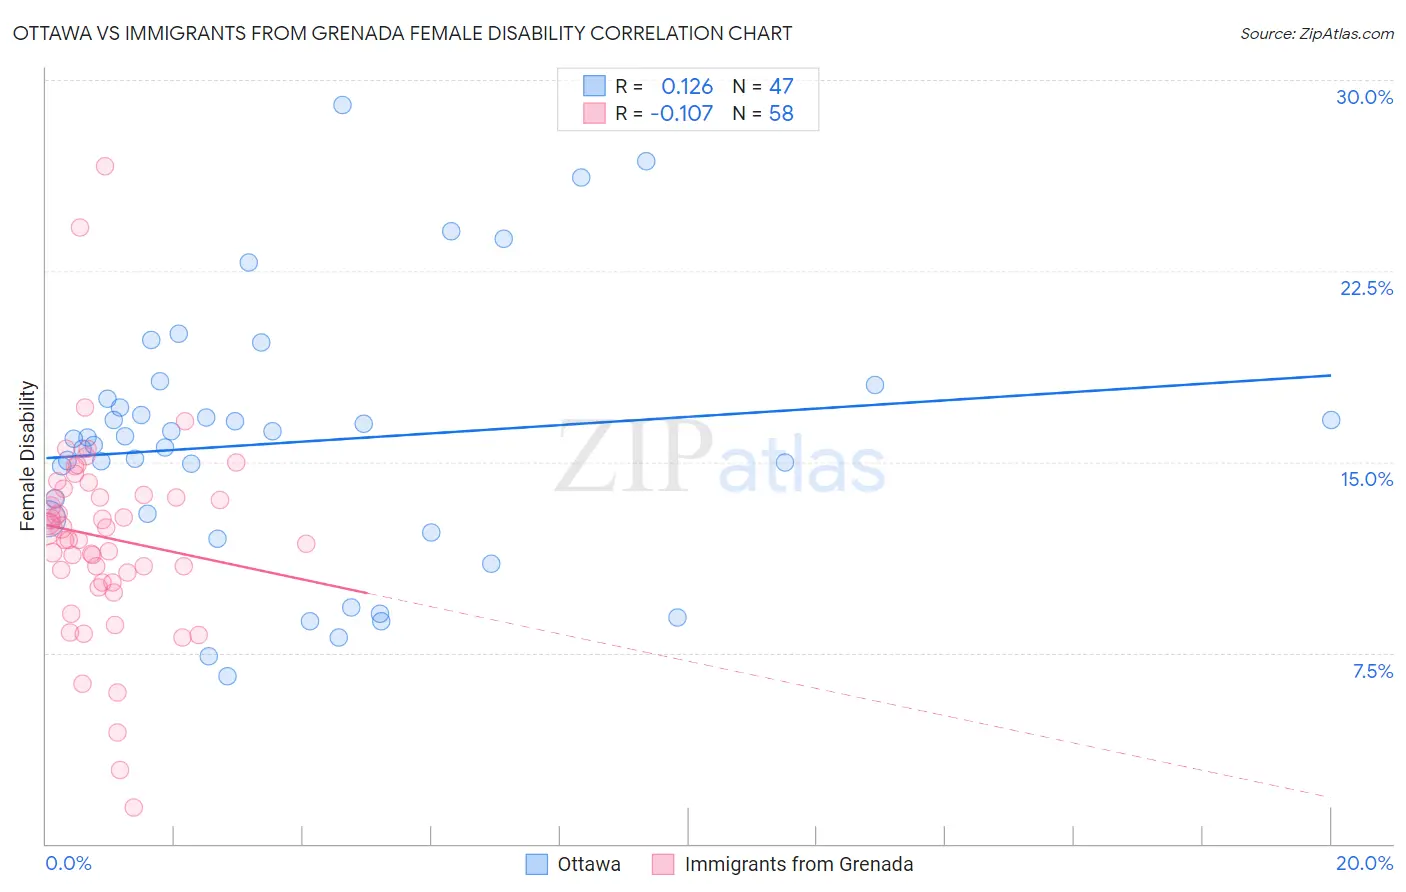
Ottawa vs Immigrants from Grenada Female Disability Correlation Chart
The statistical analysis conducted on geographies consisting of 49,954,639 people shows a poor positive correlation between the proportion of Ottawa and percentage of females with a disability in the United States with a correlation coefficient (R) of 0.126 and weighted average of 14.2%. Similarly, the statistical analysis conducted on geographies consisting of 67,188,961 people shows a poor negative correlation between the proportion of Immigrants from Grenada and percentage of females with a disability in the United States with a correlation coefficient (R) of -0.107 and weighted average of 12.4%, a difference of 15.3%.
Female Disability Correlation Summary
| Measurement | Ottawa | Immigrants from Grenada |
| Minimum | 6.6% | 1.4% |
| Maximum | 29.0% | 26.6% |
| Range | 22.4% | 25.2% |
| Mean | 15.8% | 12.0% |
| Median | 15.9% | 12.2% |
| Interquartile 25% (IQ1) | 12.8% | 10.3% |
| Interquartile 75% (IQ3) | 17.5% | 13.7% |
| Interquartile Range (IQR) | 4.7% | 3.4% |
| Standard Deviation (Sample) | 5.1% | 4.0% |
| Standard Deviation (Population) | 5.0% | 4.0% |
Similar Demographics by Female Disability
Demographics Similar to Ottawa by Female Disability
In terms of female disability, the demographic groups most similar to Ottawa are Cape Verdean (14.2%, a difference of 0.0%), Osage (14.3%, a difference of 0.43%), Comanche (14.2%, a difference of 0.44%), Navajo (14.2%, a difference of 0.55%), and Native/Alaskan (14.1%, a difference of 0.69%).
| Demographics | Rating | Rank | Female Disability |
| Americans | 0.0 /100 | #320 | Tragic 14.1% |
| Potawatomi | 0.0 /100 | #321 | Tragic 14.1% |
| Pueblo | 0.0 /100 | #322 | Tragic 14.1% |
| Blacks/African Americans | 0.0 /100 | #323 | Tragic 14.1% |
| Natives/Alaskans | 0.0 /100 | #324 | Tragic 14.1% |
| Navajo | 0.0 /100 | #325 | Tragic 14.2% |
| Comanche | 0.0 /100 | #326 | Tragic 14.2% |
| Ottawa | 0.0 /100 | #327 | Tragic 14.2% |
| Cape Verdeans | 0.0 /100 | #328 | Tragic 14.2% |
| Osage | 0.0 /100 | #329 | Tragic 14.3% |
| Yuman | 0.0 /100 | #330 | Tragic 14.5% |
| Immigrants | Cabo Verde | 0.0 /100 | #331 | Tragic 14.6% |
| Pima | 0.0 /100 | #332 | Tragic 14.8% |
| Immigrants | Azores | 0.0 /100 | #333 | Tragic 14.9% |
| Cherokee | 0.0 /100 | #334 | Tragic 14.9% |
Demographics Similar to Immigrants from Grenada by Female Disability
In terms of female disability, the demographic groups most similar to Immigrants from Grenada are Immigrants from Zaire (12.3%, a difference of 0.020%), Immigrants from Cuba (12.4%, a difference of 0.020%), Croatian (12.4%, a difference of 0.020%), Immigrants from Barbados (12.3%, a difference of 0.040%), and Somali (12.3%, a difference of 0.060%).
| Demographics | Rating | Rank | Female Disability |
| Mexican American Indians | 24.9 /100 | #198 | Fair 12.3% |
| Immigrants | Trinidad and Tobago | 24.7 /100 | #199 | Fair 12.3% |
| Trinidadians and Tobagonians | 22.4 /100 | #200 | Fair 12.3% |
| Chinese | 22.1 /100 | #201 | Fair 12.3% |
| Somalis | 21.5 /100 | #202 | Fair 12.3% |
| Immigrants | Barbados | 21.1 /100 | #203 | Fair 12.3% |
| Immigrants | Zaire | 20.9 /100 | #204 | Fair 12.3% |
| Immigrants | Grenada | 20.5 /100 | #205 | Fair 12.4% |
| Immigrants | Cuba | 20.2 /100 | #206 | Fair 12.4% |
| Croatians | 20.2 /100 | #207 | Fair 12.4% |
| Basques | 17.5 /100 | #208 | Poor 12.4% |
| Mexicans | 15.7 /100 | #209 | Poor 12.4% |
| Swiss | 14.9 /100 | #210 | Poor 12.4% |
| Immigrants | Bosnia and Herzegovina | 14.8 /100 | #211 | Poor 12.4% |
| Ute | 14.7 /100 | #212 | Poor 12.4% |