Ottawa vs Immigrants from Haiti Per Capita Income
COMPARE
Ottawa
Immigrants from Haiti
Per Capita Income
Per Capita Income Comparison
Ottawa
Immigrants from Haiti
$37,101
PER CAPITA INCOME
0.1/ 100
METRIC RATING
301st/ 347
METRIC RANK
$36,849
PER CAPITA INCOME
0.0/ 100
METRIC RATING
306th/ 347
METRIC RANK
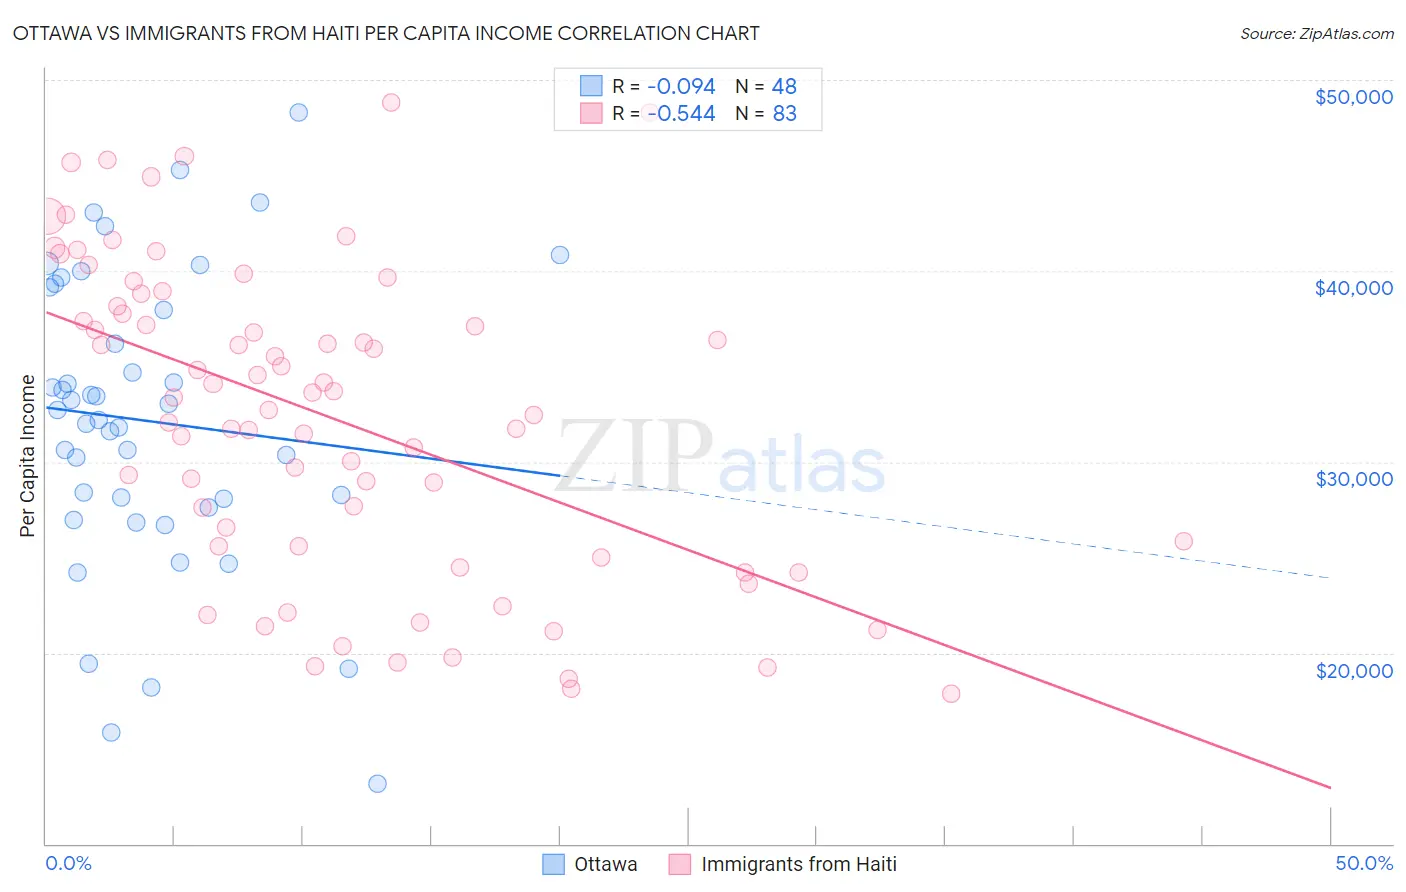
Ottawa vs Immigrants from Haiti Per Capita Income Correlation Chart
The statistical analysis conducted on geographies consisting of 49,956,726 people shows a slight negative correlation between the proportion of Ottawa and per capita income in the United States with a correlation coefficient (R) of -0.094 and weighted average of $37,101. Similarly, the statistical analysis conducted on geographies consisting of 225,290,875 people shows a substantial negative correlation between the proportion of Immigrants from Haiti and per capita income in the United States with a correlation coefficient (R) of -0.544 and weighted average of $36,849, a difference of 0.69%.
Per Capita Income Correlation Summary
| Measurement | Ottawa | Immigrants from Haiti |
| Minimum | $13,161 | $17,858 |
| Maximum | $48,274 | $48,799 |
| Range | $35,113 | $30,941 |
| Mean | $32,137 | $32,340 |
| Median | $32,448 | $33,392 |
| Interquartile 25% (IQ1) | $27,814 | $25,569 |
| Interquartile 75% (IQ3) | $38,554 | $38,157 |
| Interquartile Range (IQR) | $10,740 | $12,588 |
| Standard Deviation (Sample) | $7,713 | $8,072 |
| Standard Deviation (Population) | $7,632 | $8,023 |
Demographics Similar to Ottawa and Immigrants from Haiti by Per Capita Income
In terms of per capita income, the demographic groups most similar to Ottawa are Shoshone ($37,072, a difference of 0.080%), Paiute ($37,066, a difference of 0.10%), Honduran ($37,031, a difference of 0.19%), Immigrants from Bahamas ($37,193, a difference of 0.25%), and Cherokee ($37,203, a difference of 0.27%). Similarly, the demographic groups most similar to Immigrants from Haiti are Immigrants from Latin America ($36,823, a difference of 0.070%), Inupiat ($36,999, a difference of 0.41%), Fijian ($36,690, a difference of 0.43%), Honduran ($37,031, a difference of 0.49%), and Immigrants from Honduras ($36,665, a difference of 0.50%).
| Demographics | Rating | Rank | Per Capita Income |
| Mexican American Indians | 0.1 /100 | #293 | Tragic $37,407 |
| Cubans | 0.1 /100 | #294 | Tragic $37,383 |
| Immigrants | Dominican Republic | 0.1 /100 | #295 | Tragic $37,306 |
| Indonesians | 0.1 /100 | #296 | Tragic $37,300 |
| Haitians | 0.1 /100 | #297 | Tragic $37,289 |
| Immigrants | Caribbean | 0.1 /100 | #298 | Tragic $37,254 |
| Cherokee | 0.1 /100 | #299 | Tragic $37,203 |
| Immigrants | Bahamas | 0.1 /100 | #300 | Tragic $37,193 |
| Ottawa | 0.1 /100 | #301 | Tragic $37,101 |
| Shoshone | 0.1 /100 | #302 | Tragic $37,072 |
| Paiute | 0.1 /100 | #303 | Tragic $37,066 |
| Hondurans | 0.1 /100 | #304 | Tragic $37,031 |
| Inupiat | 0.1 /100 | #305 | Tragic $36,999 |
| Immigrants | Haiti | 0.0 /100 | #306 | Tragic $36,849 |
| Immigrants | Latin America | 0.0 /100 | #307 | Tragic $36,823 |
| Fijians | 0.0 /100 | #308 | Tragic $36,690 |
| Immigrants | Honduras | 0.0 /100 | #309 | Tragic $36,665 |
| Ute | 0.0 /100 | #310 | Tragic $36,651 |
| Chippewa | 0.0 /100 | #311 | Tragic $36,631 |
| Chickasaw | 0.0 /100 | #312 | Tragic $36,475 |
| Bahamians | 0.0 /100 | #313 | Tragic $36,427 |