Ottawa vs Immigrants from Japan Per Capita Income
COMPARE
Ottawa
Immigrants from Japan
Per Capita Income
Per Capita Income Comparison
Ottawa
Immigrants from Japan
$37,101
PER CAPITA INCOME
0.1/ 100
METRIC RATING
301st/ 347
METRIC RANK
$53,359
PER CAPITA INCOME
100.0/ 100
METRIC RATING
25th/ 347
METRIC RANK
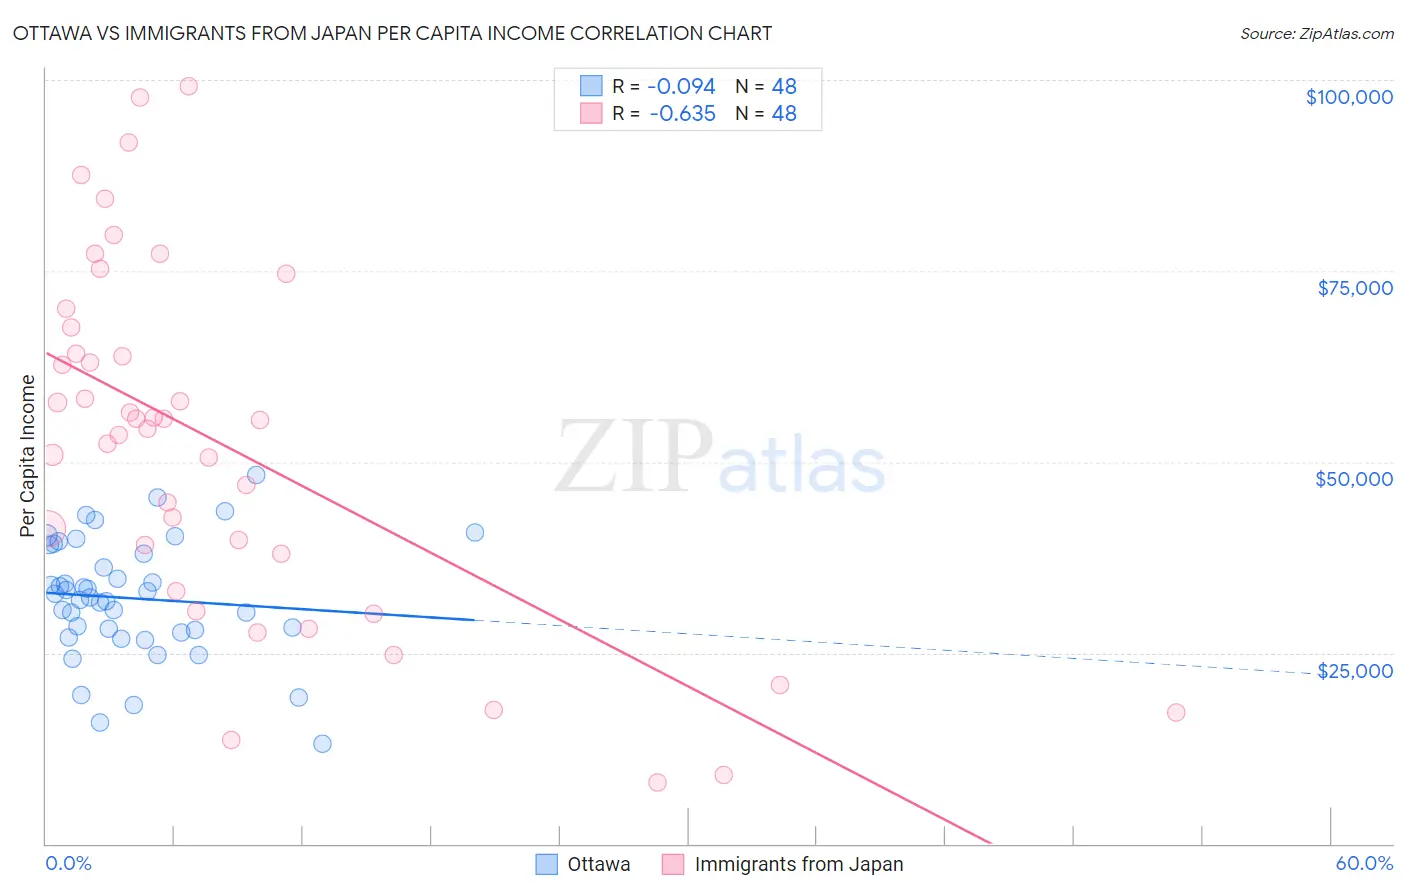
Ottawa vs Immigrants from Japan Per Capita Income Correlation Chart
The statistical analysis conducted on geographies consisting of 49,956,726 people shows a slight negative correlation between the proportion of Ottawa and per capita income in the United States with a correlation coefficient (R) of -0.094 and weighted average of $37,101. Similarly, the statistical analysis conducted on geographies consisting of 340,161,368 people shows a significant negative correlation between the proportion of Immigrants from Japan and per capita income in the United States with a correlation coefficient (R) of -0.635 and weighted average of $53,359, a difference of 43.8%.
Per Capita Income Correlation Summary
| Measurement | Ottawa | Immigrants from Japan |
| Minimum | $13,161 | $8,097 |
| Maximum | $48,274 | $99,130 |
| Range | $35,113 | $91,033 |
| Mean | $32,137 | $52,166 |
| Median | $32,448 | $54,914 |
| Interquartile 25% (IQ1) | $27,814 | $35,570 |
| Interquartile 75% (IQ3) | $38,554 | $65,919 |
| Interquartile Range (IQR) | $10,740 | $30,349 |
| Standard Deviation (Sample) | $7,713 | $23,163 |
| Standard Deviation (Population) | $7,632 | $22,920 |
Similar Demographics by Per Capita Income
Demographics Similar to Ottawa by Per Capita Income
In terms of per capita income, the demographic groups most similar to Ottawa are Shoshone ($37,072, a difference of 0.080%), Paiute ($37,066, a difference of 0.10%), Honduran ($37,031, a difference of 0.19%), Immigrants from Bahamas ($37,193, a difference of 0.25%), and Cherokee ($37,203, a difference of 0.27%).
| Demographics | Rating | Rank | Per Capita Income |
| Cubans | 0.1 /100 | #294 | Tragic $37,383 |
| Immigrants | Dominican Republic | 0.1 /100 | #295 | Tragic $37,306 |
| Indonesians | 0.1 /100 | #296 | Tragic $37,300 |
| Haitians | 0.1 /100 | #297 | Tragic $37,289 |
| Immigrants | Caribbean | 0.1 /100 | #298 | Tragic $37,254 |
| Cherokee | 0.1 /100 | #299 | Tragic $37,203 |
| Immigrants | Bahamas | 0.1 /100 | #300 | Tragic $37,193 |
| Ottawa | 0.1 /100 | #301 | Tragic $37,101 |
| Shoshone | 0.1 /100 | #302 | Tragic $37,072 |
| Paiute | 0.1 /100 | #303 | Tragic $37,066 |
| Hondurans | 0.1 /100 | #304 | Tragic $37,031 |
| Inupiat | 0.1 /100 | #305 | Tragic $36,999 |
| Immigrants | Haiti | 0.0 /100 | #306 | Tragic $36,849 |
| Immigrants | Latin America | 0.0 /100 | #307 | Tragic $36,823 |
| Fijians | 0.0 /100 | #308 | Tragic $36,690 |
Demographics Similar to Immigrants from Japan by Per Capita Income
In terms of per capita income, the demographic groups most similar to Immigrants from Japan are Russian ($53,154, a difference of 0.39%), Immigrants from Denmark ($53,799, a difference of 0.82%), Immigrants from Eastern Asia ($53,806, a difference of 0.84%), Indian (Asian) ($53,874, a difference of 0.97%), and Immigrants from South Central Asia ($52,660, a difference of 1.3%).
| Demographics | Rating | Rank | Per Capita Income |
| Thais | 100.0 /100 | #18 | Exceptional $54,307 |
| Immigrants | China | 100.0 /100 | #19 | Exceptional $54,264 |
| Soviet Union | 100.0 /100 | #20 | Exceptional $54,202 |
| Immigrants | Northern Europe | 100.0 /100 | #21 | Exceptional $54,159 |
| Indians (Asian) | 100.0 /100 | #22 | Exceptional $53,874 |
| Immigrants | Eastern Asia | 100.0 /100 | #23 | Exceptional $53,806 |
| Immigrants | Denmark | 100.0 /100 | #24 | Exceptional $53,799 |
| Immigrants | Japan | 100.0 /100 | #25 | Exceptional $53,359 |
| Russians | 100.0 /100 | #26 | Exceptional $53,154 |
| Immigrants | South Central Asia | 100.0 /100 | #27 | Exceptional $52,660 |
| Latvians | 100.0 /100 | #28 | Exceptional $52,649 |
| Israelis | 100.0 /100 | #29 | Exceptional $52,596 |
| Immigrants | Austria | 100.0 /100 | #30 | Exceptional $52,503 |
| Turks | 100.0 /100 | #31 | Exceptional $52,391 |
| Immigrants | Norway | 100.0 /100 | #32 | Exceptional $52,217 |